


 8 / 16

8
MULTIFAMILY INVESTMENT SOUTH FLORIDA TEAM
| SOUTH FLORIDA
Cushman & Wakefield
BROWARD
MULTIFAMILY MARKET SUMMARY
YEAR
$ SALES VOLUME
# OF
SALES
TOTAL #
OF UNITS
ASKING
RENT
ASKING
RENT
PSF
ASKING
RENT
GROWTH
EFFECTIVE
RENT
EFFECTIVE
RENT PSF
EFFECTIVE
RENT
GROWTH
VACANCY
NET
ABSORP
NEW
UNITS
2017 (YTD) $13,018,900
7
115,548 $1,383 $1.42
0.3% $1,361
$1.40
0.0% 5.5% 575 92
2016
$1,048,995,200 89 115,507 $1,379 $1.42
3.5% $1,361
$1.40
2.5% 6.0% -270 3,179
2015
$1,585,508,531 102 113,564 $1,333 $1.38
7.9% $1,328
$1.37
8.1% 4.1% 2,416 2,349
2014
$771,870,300
79 111,256 $1,235 $1.27
5.8% $1,228
$1.27
6.0% 4.3% 3,183 3,134
2013
$598,883,060
67 108,375 $1,167 $1.21
4.3% $1,159
$1.20
4.4% 4.7% 3,231 3,275
2012
$723,801,200
61
105,198 $1,119 $1.16
2.9% $1,110
$1.15
2.8% 4.9% 1,225 1,018
2011
$377,812,000
31
104,472 $1,087 $1.13
1.3% $1,080
$1.12
1.3% 5.4% 823 725
2010
$479,334,800
20 103,888 $1,073 $1.12
2.5% $1,066
$1.11
2.6% 5.7% 2,553 935
2009
$146,662,500
28 103,045 $1,047 $1.09 -3.2% $1,039
$1.08
-3.2% 7.5% 1,944 2,123
2008
$211,643,000
23 100,925 $1,082 $1.13
-3.6% $1,073
$1.12
-3.7% 7.4% 365 883
$15 MILLION $1.85 MILLION $117 PSF
$92,161
2017 Sales (YTD)
YTD Average Sale Price
YTD Median Sale PSF
YTD Median Sale per Unit
$1,383
94.5%
575 UNITS
115,548 UNITS
Average Rent Per Unit
Occupancy Rate
Annual Unit Net Absorption Inventory of Rentable Units
Broward Apartments Under Construction
12
apartment buildings
totaling
4,155
units under construction
in Broward
BUILDING
CITY
# OF
UNITS
EXPECTED
COMPLETION
The Midtown Residences
Coconut Creek
308
2018
AMLI Plantation
Plantation
250
2017
Elan at College Crossings
Davie
477
2018
Harbor Park
Fort
Lauderdale
350
2018
Altis Pembroke Gardens
Pembroke
Pines
280
2018
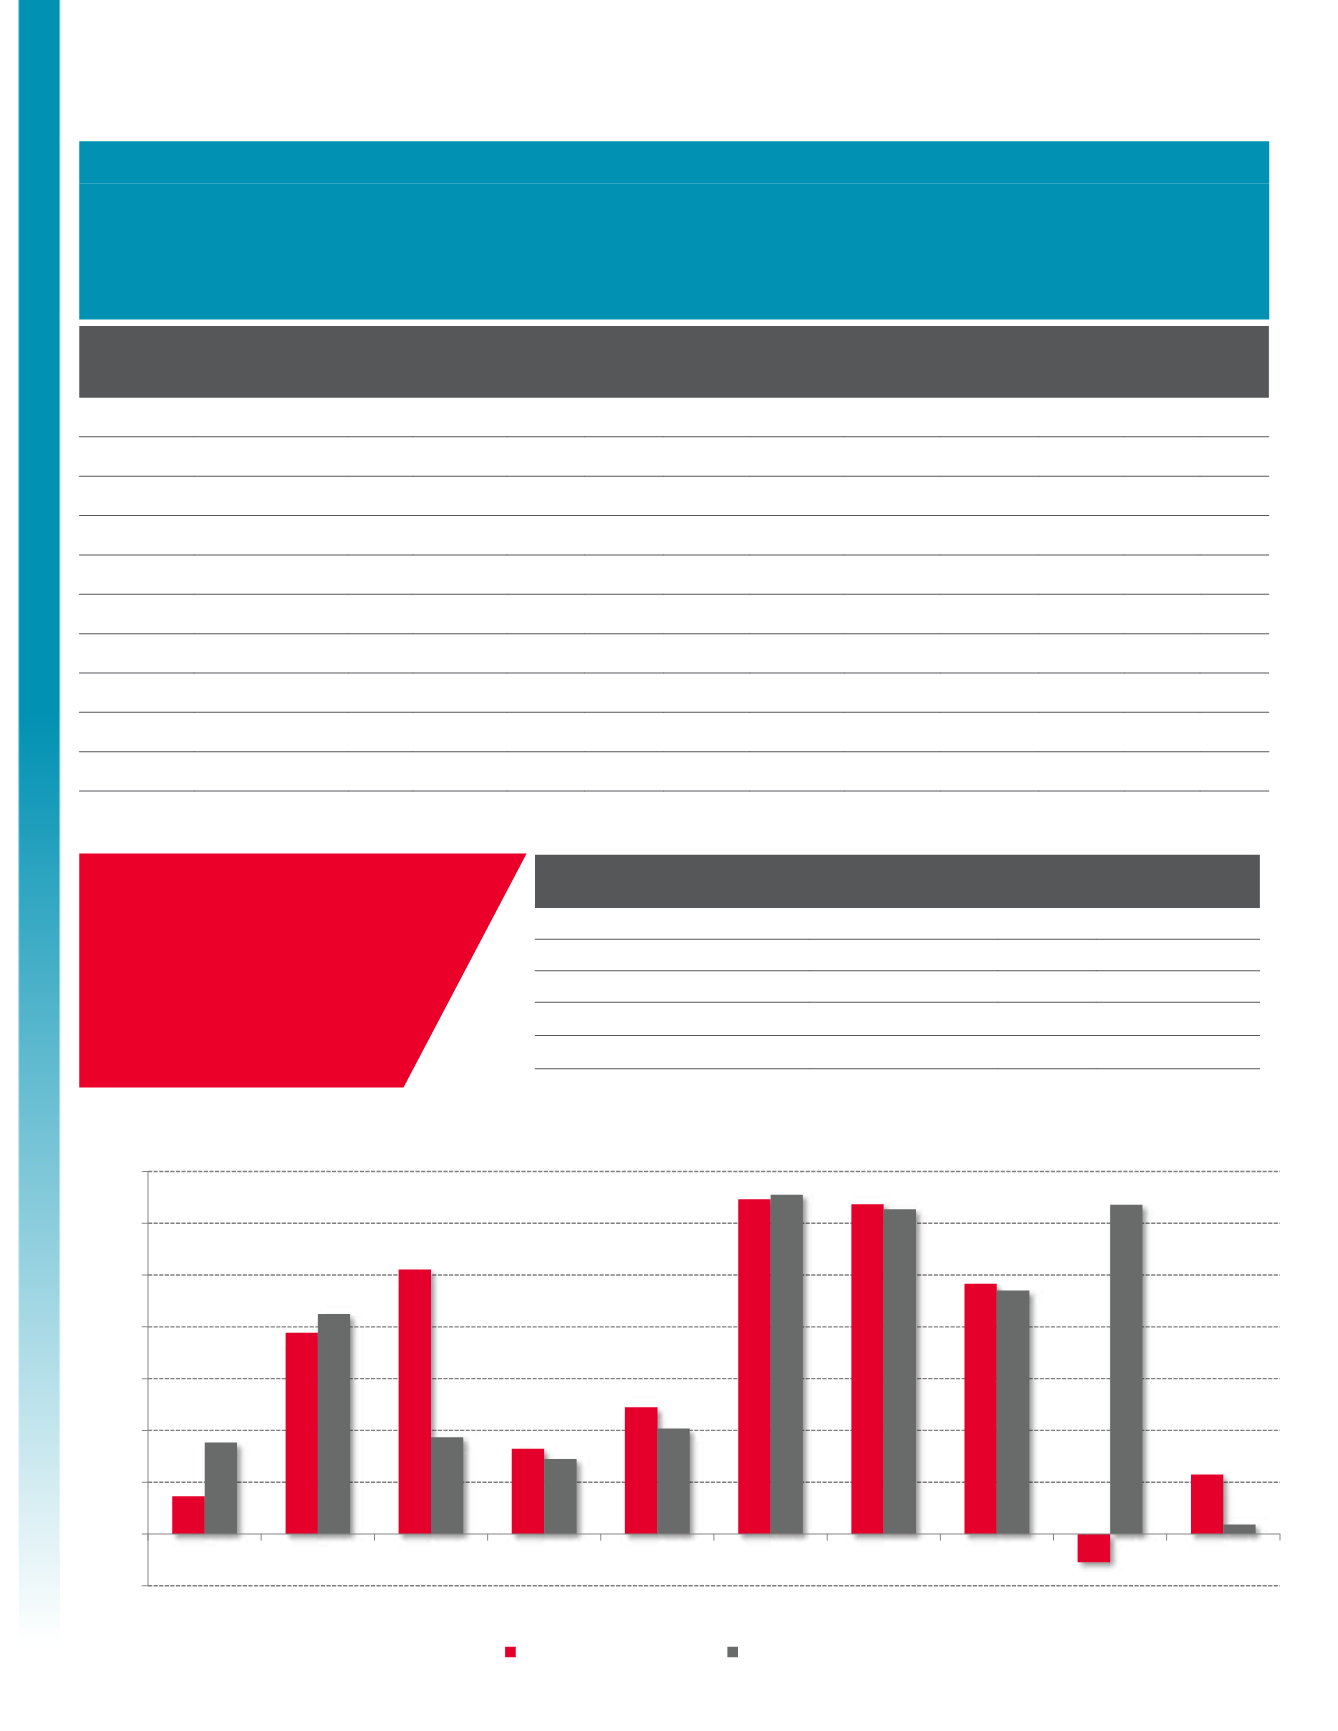
Broward Deliveries Versus Absorption
-500
0
500
1,000
1,500
2,000
2,500
3,000
3,500
2008
2009
2010
2011
2012
2013
2014
2015
2016
2017 (YTD)
Net Absorption (Units)
Deliveries (Units)