


 6 / 16

6
MULTIFAMILY INVESTMENT SOUTH FLORIDA TEAM
| SOUTH FLORIDA
Cushman & Wakefield
MIAMI-DADE
MULTIFAMILY MARKET SUMMARY
YEAR
$ SALES VOLUME
# OF
SALES
TOTAL #
OF UNITS
ASKING
RENT
ASKING
RENT
PSF
ASKING
RENT
GROWTH
EFFECTIVE
RENT
EFFECTIVE
RENT PSF
EFFECTIVE
RENT
GROWTH
VACANCY
NET
ABSORP
NEW
UNITS
2017
$165,196,100
23 153,442 $1,289 $1.52
0.4% $1,261
$1.49
0.1% 4.0% 444 468
2016 $1,268,653,900 138 153,015 $1,284 $1.51
5.5% $1,260
$1.49
4.6% 4.3% 2,006 4,006
2015 $918,049,900
147 149,264 $1,217 $1.44
6.6% $1,205
$1.43
6.1% 3.5% 3,357 3,340
2014 $721,553,000
164 146,208 $1,142 $1.36
4.0% $1,136
$1.36
3.9% 3.8% 2,858 3,568
2013 $540,725,900 107 143,246 $1,098 $1.32
4.3% $1,093
$1.31
4.5% 3.8% 1,962 1,666
2012 $528,063,000 100 141,867 $1,053 $1.27
4.1% $1,046
$1.26
4.0% 4.3% 991
1,896
2011
$222,063,600 76 140,521 $1,012 $1.22
1.1% $1,006
$1.21
1.0% 4.1% 1,221
1,703
2010 $184,819,533
52 139,708 $1,001 $1.21
1.7% $996
$1.20
1.9% 4.4% 1,998 903
2009 $187,155,924
40 138,933 $984 $1.19
-2.8% $977
$1.18
-2.8% 5.4% 2,084 2,099
2008 $110,937,600
45 137,054 $1,012 $1.23
-3.0% $1,005
$1.22
-3.0% 5.7% -144 1,792
$165 MILLION $7.2 MILLION
$177 PSF
$130,000
2017 Sales (YTD)
YTD Average Sale Price YTD Median Average Sale PSF YTD Median Sale per Unit
$1,289
96.0%
444 UNITS
153,442 UNITS
Average Rent Per Unit
Occupancy Rate
Annual Unit Net Absorption Inventory of Rentable Units
Miami-Dade Apartments Under Construction
28
apartment buildings
totaling
9,863
units under construction
in Miami-Dade
BUILDING
CITY
# OF
UNITS
EXPECTED
COMPLETION
Villas de Palmas
Hialeah
226
2018
Modera Station II
Coral Gables
181
2017
Pearl Midtown
Miami
309
2018
Solitair Brickell
Miami
+438
2018
Avant at Met Square
Miami
391
2018
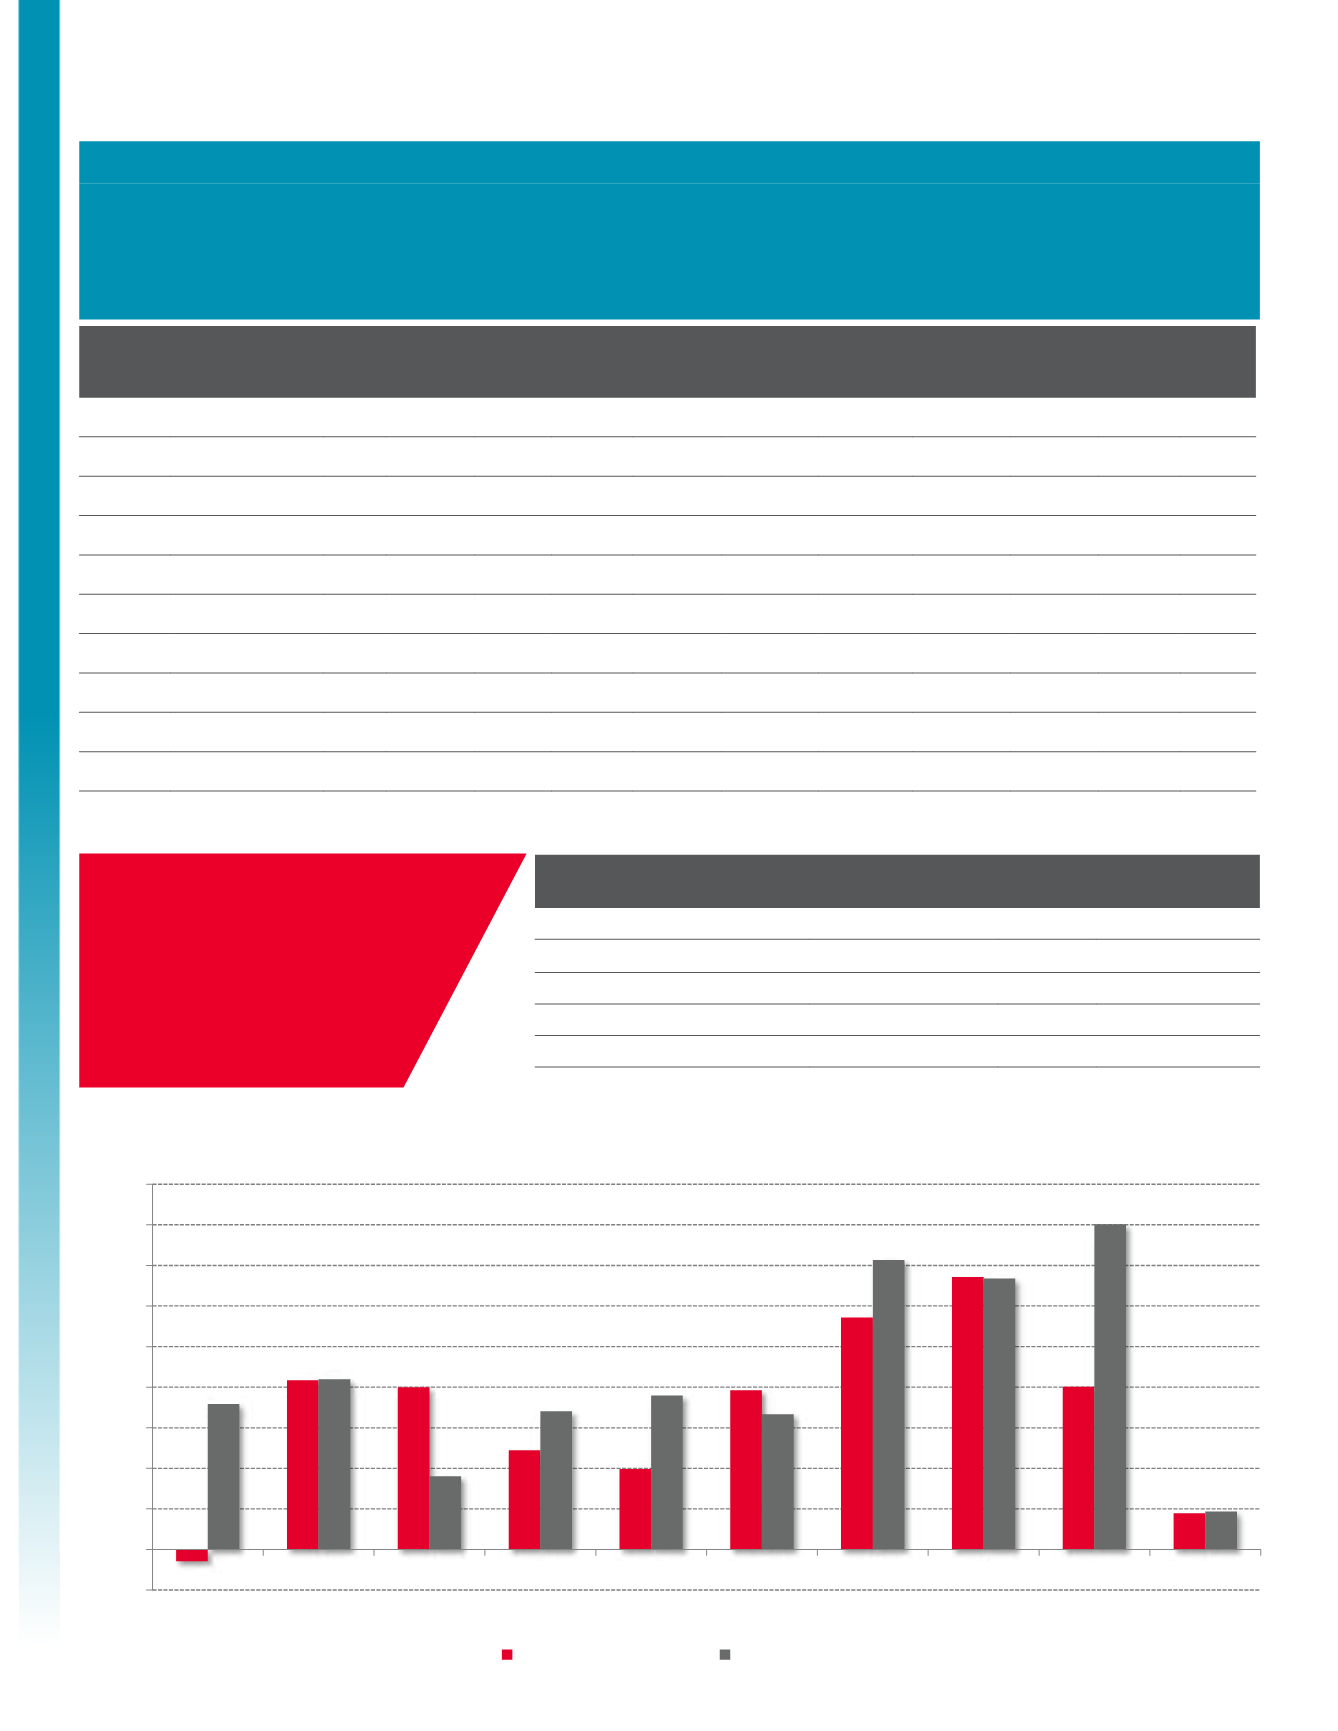
Miami-Dade Deliveries Versus Absorption
-500
0
500
1,000
1,500
2,000
2,500
3,000
3,500
4,000
4,500
2008
2009
2010
2011
2012
2013
2014
2015
2016
2017 (YTD)
Net Absorption (Units)
Deliveries (Units)