


 5 / 16

5
MULTIFAMILY INVESTMENT SOUTH FLORIDA TEAM
| SOUTH FLORIDA
Cushman & Wakefield
APARTMENT MARKET REPORT
DEBT MARKETS
EQUITY MARKETS
CAPITAL
MAX LTV
DSCR INVESTMENT PROFILE
LEVERAGED IRR
Credit Company
Up To 80%
1.00 -1.25x Core
6%-9%
Life Company
Up To 70%
1.25 -1.30x Core-Plus
10%-13%
Bank
Up To 65%
<1.00 -1.20x Value-Add
14%-17%
Agency / Conduit
See Indicative Pricing Below
1.25 -1.35x Opportunistic/Development
+18%
INDICATIVE PRICING
FANNIE FIXED*
DSCR/LTV INDEX SPREAD* COUPON*
FANNIE 7-YR ARM*
INDEX SPREAD* COUPON* CAPPED RATE
5 YR
1.25x / 75%
1.87
2.59
4.46
1.00x / 75%
0.98
2.29
3.27
3rd Party
7 YR
1.25x / 80%
2.16
2.23
4.39
1.10x / 65%
0.98
2.05
3.03
3rd Party
10 YR
1.25x / 80%
2.35
2.17
4.52
1.30x / 55%
0.98
1.82
2.80
3rd Party
CONDUIT
DSCR/LTV INDEX SPREAD COUPON OTHER PROGRAMS INDEX SPREAD COUPON COMMENTS
5 YR
1.25x / 75% 2.00
+/-2.95
4.95
HUD A7
N/A
N/A
3.69
Excludes MIP
10 YR
1.25x / 77% 2.34
+/-2.30
4.64
HUD 223(f)
N/A
N/A
3.69
Excludes MIP
10 YR w/Sub debt
1.10x / 85% 2.34
+/-2.80
5.14
HUD 221(d)(4)
N/A
N/A
4.27
Excludes MIP
April 5, 2017
COUPON
3.50%-6.00%
3.00%-3.75%
2.50%-4.50%
Cushman & Wakefield is not a direct seller servicer. Through our correspondent agreements, C&W acts as an advisor to our clients for capital raises, including
Fannie, Freddie & FHA executions.
* Indicative Fannie Mae spreads assume no pricing waiver. Pricing waivers can be obtained and may reduce rates up to 50 basis points depending on the loan size,
market, property condition, borrower, and other relevant factors.
1.40%
1.60%
1.80%
2.00%
2.20%
2.40%
2.60%
2.80%
3.00%
3.20%
1.00%
1.50%
2.00%
2.50%
3.00%
3.50%
4.00%
4.50%
5.00%
5.50%
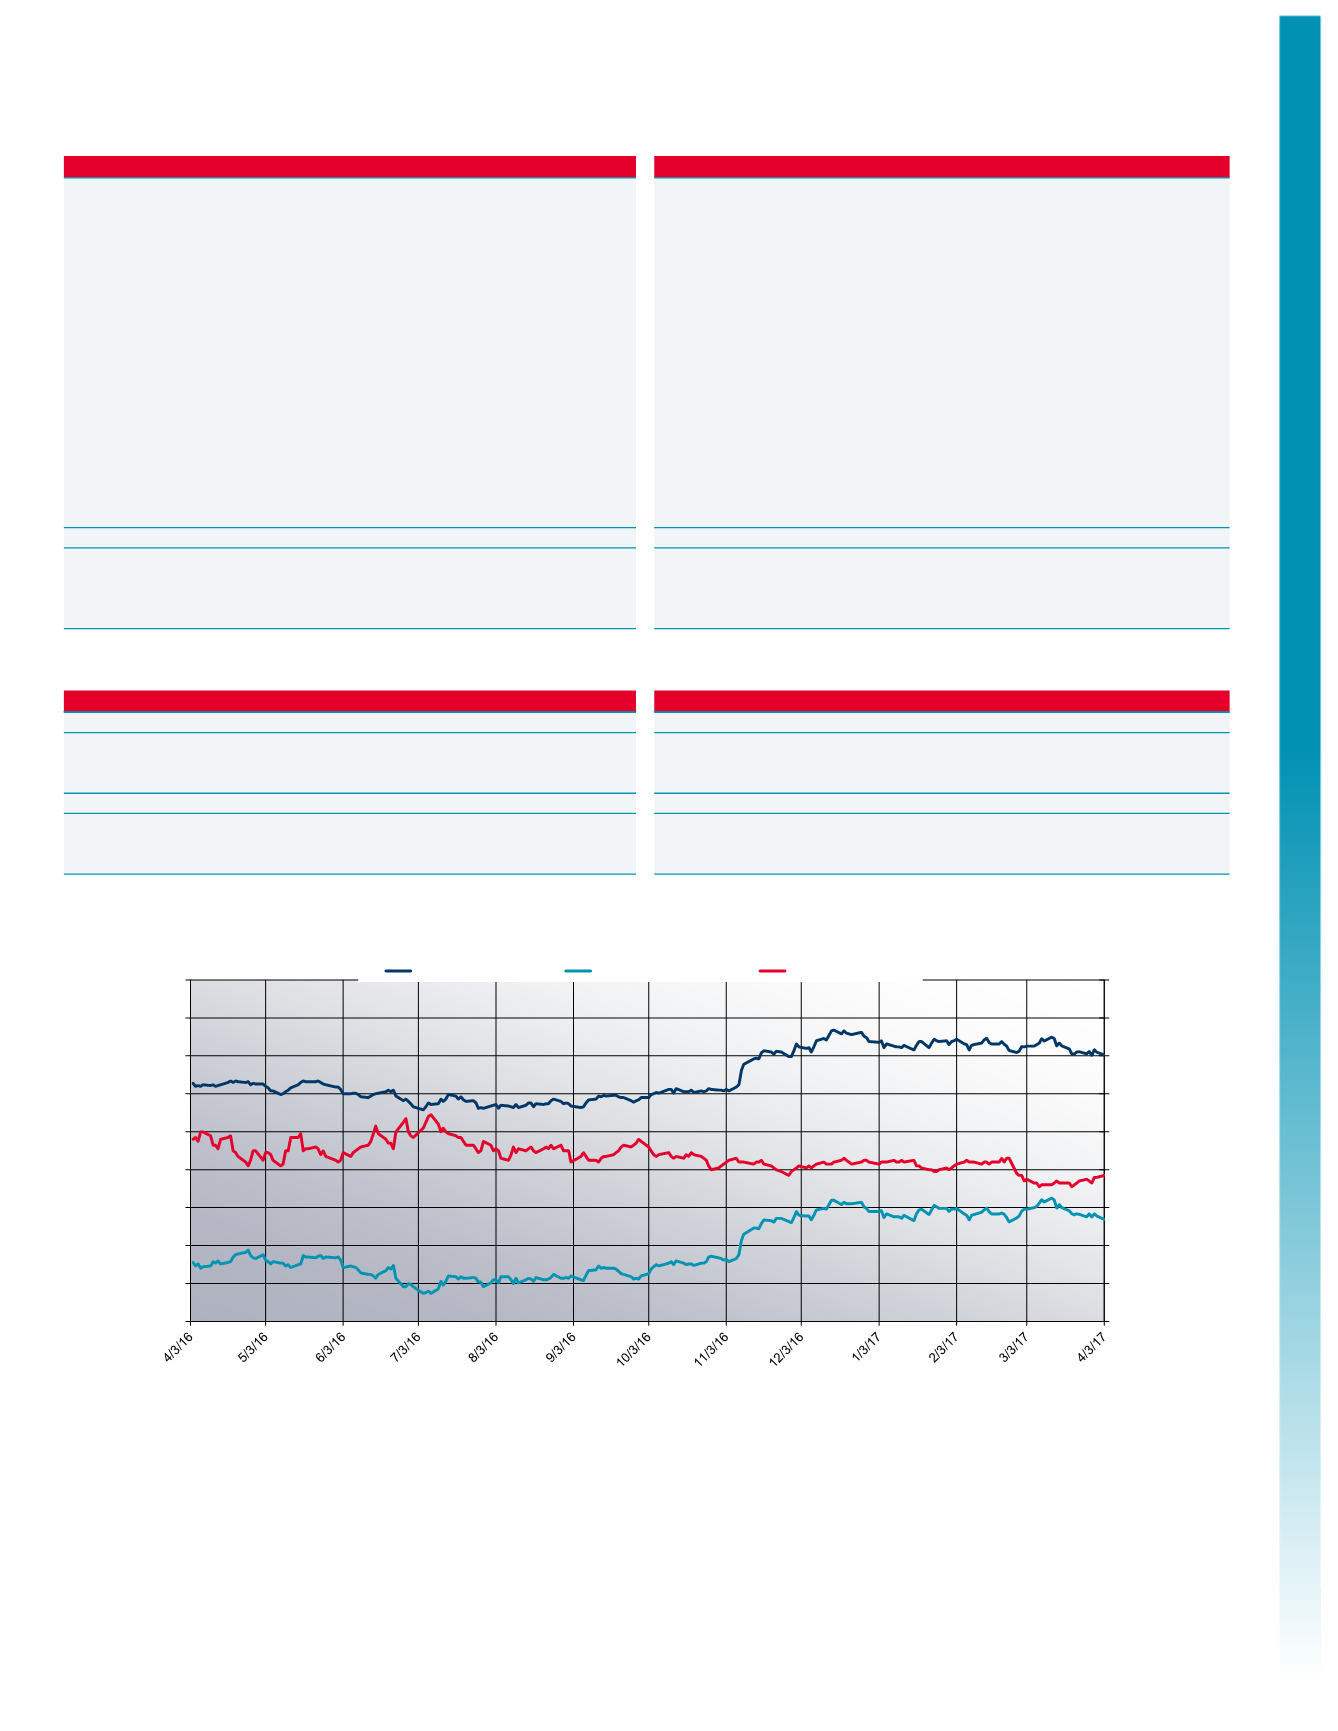
SPREADS
10-YEAR TREASURY
& ALL-IN COUPON
10-YEAR AGENCY AND RATE TRENDS
ALL - IN LOAN RATE
TEN YEAR TREASURY
AGENCY SPREAD
Atlanta
Boston
Chicago
Los Angeles
San Francisco
Washington, D.C.
•
MBA projections of increased commercial real estate activity in U.S. during
2017 are supported in part by expectation of rising interest rates. Real estate
is viewed as a hedge against inflation, and investors both domestic and
foreign, continue to view U.S. commercial real estate as a safe haven.
•
There are currently 466 active fund vehicles managed by 374 operators, the
majority of which are either exclusively focused on multifamily or include
multifamily as an acceptable asset class for investment. These funds are
seeking to raise $322 billion of equity and have already closed on $234
billion of commitments - all new records.
•
However, fund operators are having a more difficult time deploying capital.
Of the $234 billion raised, $163 billion is still uninvested - up sharply from
$140 billion a year ago and $98 billion two years ago.
•
Secondary markets saw an 8.2% year over year increase in multifamily
investment between 2015 and 2016. This was largely driven by a
combination of strong job and population growth which outpaced national
averages.
•
After the 0.25% March Fed rate hike, it is unclear if the FOMC will continue
the pattern of increasing rates with a third 0.25% increment in the May or
June meeting. The continued flight to quality, and geopolitical fears have
caused 10 year yields to remain stable around 2.50% since the December
hike.
•
FOMC's Statement & Summary of Economic Projections were largely
unchanged from December's meeting, though slightly less hawkish than
some had anticipated. Reduced expectations of the pace of increases has
resulted in lower rates post announcement, as many had already priced in a
higher frequency of rate hikes.
•
The Mortgage Bankers Association is forecasting $515 billion of lending
activity for 2017, which would top the origination record of $508 billion set in
2007. $267 billion of that volume is expected to be comprised of multifamily
loans. Last year Fannie Mae wrote $55.3 billion and Freddie Mac wrote
$56.8 billion. While both are subject to origination caps, they're able to
exceed those caps when they write loans against affordable housing.
Robert Kaplan
Executive
Managing Director
Capital Markets Group
Equity, Debt & Structured Finance
Direct:
305-533-2860
Cell:
305-794-5672
Christopher H. Lentz, CFA
Senior Director
Capital Markets Group
Equity, Debt & Structured Finance
Direct:
305-533-2865
Mobile:
917-679-2824
Mark Rutherford
Analyst
Capital Markets Group
Equity, Debt & Structured Finance
Direct:
305-533-2864
Fax:
305-375-0056
MULTIFAMILY DEBT UPDATE
APRIL 2017