


 2 / 16

2
MULTIFAMILY INVESTMENT SOUTH FLORIDA TEAM
| SOUTH FLORIDA
Cushman & Wakefield
$0
$20
$40
$60
$80
$100
$120
$140
$160
$180
$200
$0
$25,000
$50,000
$75,000
$100,000
$125,000
$150,000
$175,000
$200,000
$225,000
2004
2005
2006
2007
2008
2009
2010
2011
2012
2013
2014
2015
2016
2017 (YTD)
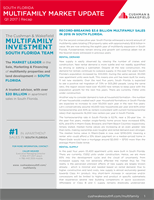
Price Per SF
Price per Unit
SOUTH FLORIDA HISTORICAL PRICE/UNIT VERSUS PRICE /SF
Average per Unit
Average Per SF
Miami-Dade
Broward
Palm Beach
0
75
150
225
300
375
$0.0
$0.5
$1.0
$1.5
$2.0
$2.5
$3.0
$3.5
$4.0
$4.5
$5.0
2004
2005
2006
2007
2008
2009
2010
2011
2012
2013
2014
2015
2016
2017 (YTD)
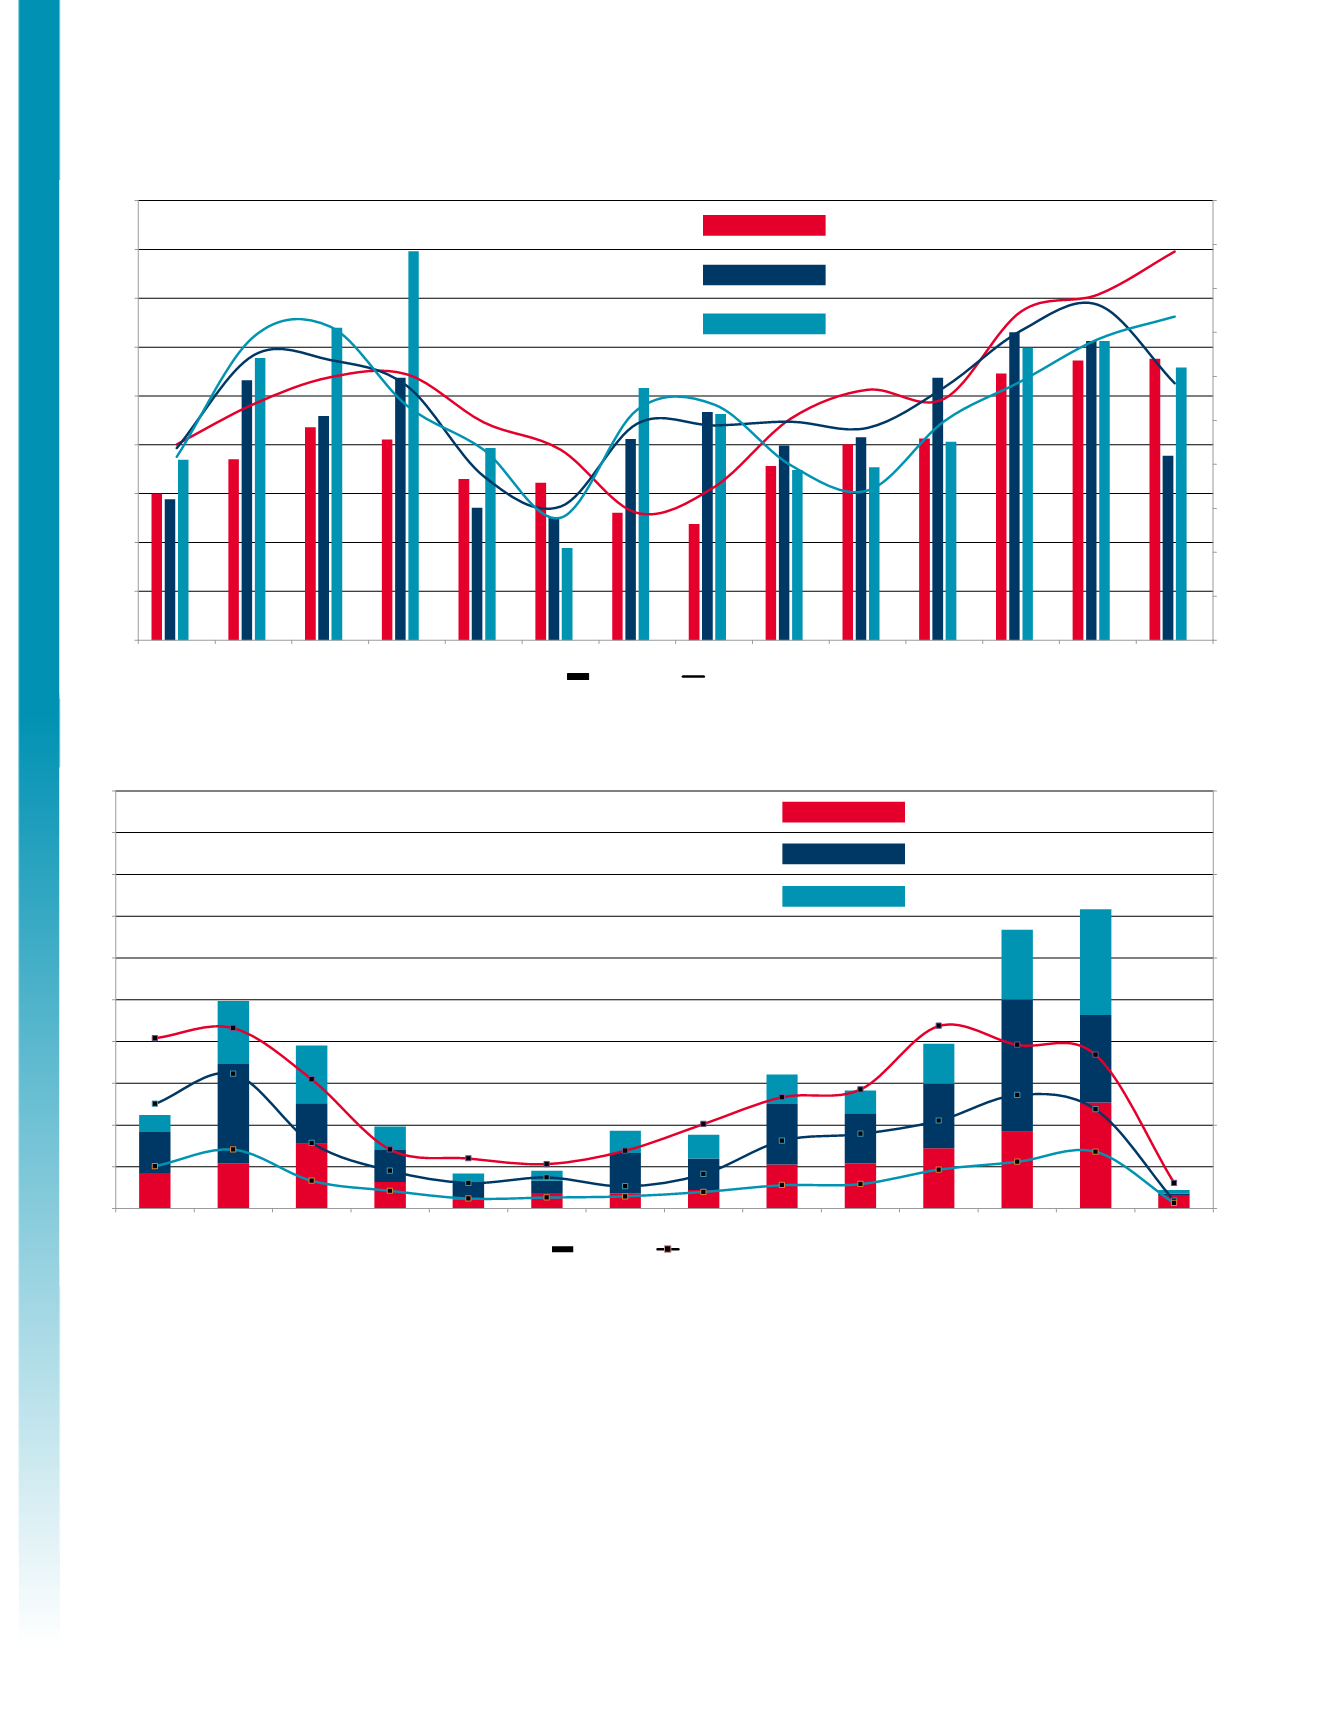
Number of Transactions
Dollar Volume
Billions
SOUTH FLORIDA HISTORICAL TRANSACTION VOLUME VERSUS NUMBER OF TRANSACTIONS
Dollar Volume
Number of Transactions
Miami-Dade
Broward
Palm Beach
MULTIFAMILY INVESTMENT SALES ANALYSIS / SOUTH FLORIDA
South Florida Historical Price/Unit Versus Price /SF
$0
$20
$40
$60
$80
$100
$120
$140
$160
$180
$200
$0
$25,000
$50,000
$75,000
$100,000
$125,000
$150,000
$175,000
$200,000
$225,000
2004
2005
2006
2007
2008
2009
2010
2011
2012
2013
2014
2015
2016
2017 (YTD)
Price Per SF
Price per Unit
S
FL I IS I L I / I
S S I /SF
Average per Unit
Average Per SF
ia i-Dade
Broward
Pal Beach
0
75
150
225
300
375
$0.0
$0.5
$1.0
$1.5
$2.0
$2.5
$3.0
$3.5
$4.0
$4.5
$5.0
2004
2005
2006
2007
2008
2009
2010
2011
2012
2013
2014
2015
2016
2017 (YTD)
Number of Transactions
Dollar Volume
Billions
SOUTH FLORIDA HISTORICAL TRANSACTION VOLUME VERSUS NUMBER OF TRANSACTIONS
Dollar Volume
Number of Transactions
ia i-Dade
Broward
Pal Beach
South Florida Historical Transaction Volume Versus Number of Transactions
Lastly, it’s necessary to consider the
impact of new condo construction
on the rental market through a
“shadow rental market.” According to
CraneSpotters.com, in the tri-county
area, there are 106 condo buildings
totaling over 13,066 units that are
currently under construction. It is likely
that many of the under construction
condominiums may end up in the rental
pool as absentee owners try to bring
in income to offset their expenses. Yet
the rents on these units are unlikely
to meet the condominium owners
HOA and tax obligations. A small
percentage of Class AAA buildings
that are achieving rents over $3 per
square foot will increasingly compete
for renters from the shadow market.
Yet even with this competing supply,
the demand for rentals, absorption
levels, a growing population, low
home ownership levels, increased
single-family home pricing all point
towards the units being leased in short
order without any negative impact
on rents. Any softening in the market
is more likely to occur in the condo
resale market as investors realize the
prospect at renting their condo at a
profit is marginal and decide to sell.
YTD
YTD
1
Source: U.S. Department of Labor, Bureau of Labor Statistics, 2017
* +$1 million multifamily sales
* +$1 million multifamily sales