


 43 / 60

page 43
5.4 Total Expenditure
The industry recognises it needs to improve efficiency and reduce costs for sustainable operations in a world of
lower oil prices, while upholding the imperative to maintain safe production. Over the last 18 months, individual
companies have looked to readjust their businesses to secure their future by rationalising capital budgets, reducing
operational costs and increasing efficiencies, particularly as medium-term price expectations have dampened.
Pan-industry, co-operative efforts to increase efficiency across the sector have also been important. This work
initially began in the first half of 2014, but was stepped up through the formal launch of Oil & Gas UK’s Efficiency
Task Force in September 2015 (see Appendix for more details on the Task Force’s initiatives).
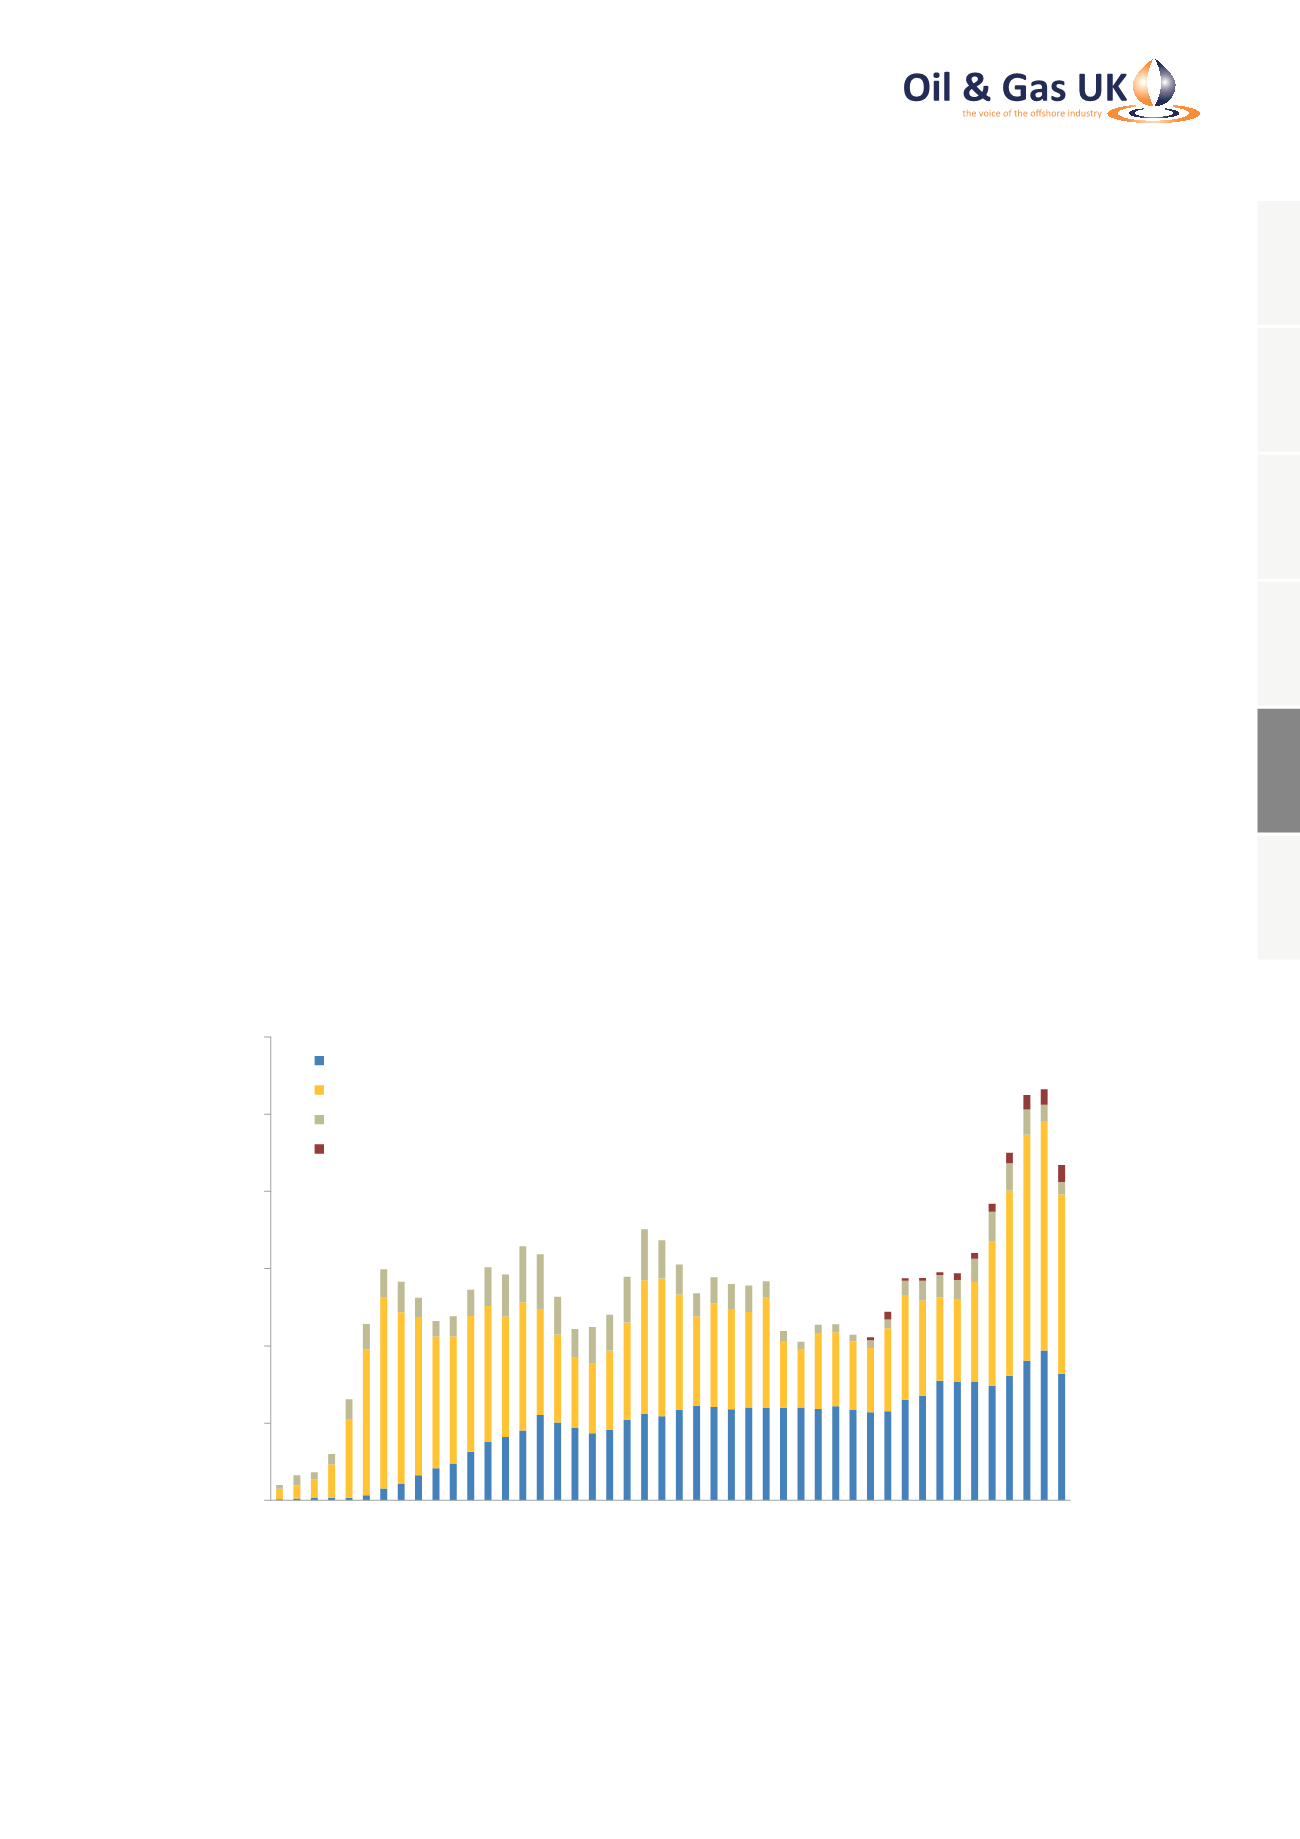
Over the course of 2015, industry efforts have seen total expenditure fall by almost £5 billion, from £26.6 billion
to £21.7 billion. However, the oil price has continued to fall and measures to reduce costs that may have been
sufficient at $50-60/bbl will now need to be revisited as companies are forced to make their businesses robust at
current prices.
The immediate desire for cash flow and ongoing transformational change mean that further efficiency gains
and expenditure reductions are likely during the course of 2016. Without such cost reductions many companies
working on the UKCS will simply cease to exist. The restructuring of the industry so far has been painful for many,
especially for the tens of thousands who are estimated to have lost their jobs in the UK. The sobering human cost
makes it all the more important that the industry redoubles its efforts so that the sector can emerge from the
downturn with the competitive and efficient cost base it will need to ensure an enduring future. Changing the way
business is done on the UKCS will help to maintain the cost improvements through future price movements.
Figure 32: Total Expenditure on the UK Continental Shelf
0
5
10
15
20
25
30
1970 1975 1980 1985 1990 1995 2000 2005 2010 2015
Total Expenditure (£ Billion - 2015 Money)
Operating Costs
Development Costs
Exploration and Appraisal Costs
Decommissioning Costs
Source: Oil & Gas UK, OGA
1
2
3
4
5
6