


 5 / 168

2014 Best
Practices Study
Agencies
with
Revenues
Under
$1,250,000
5
Analysis of Agencies with Revenues Under $1,250,000
Key Benchmarks
Profile
Revenues
Expenses
Profitability
Employee Overview
Producer Info
Service Staff Info
Technology
Insurance Carriers
Appendix
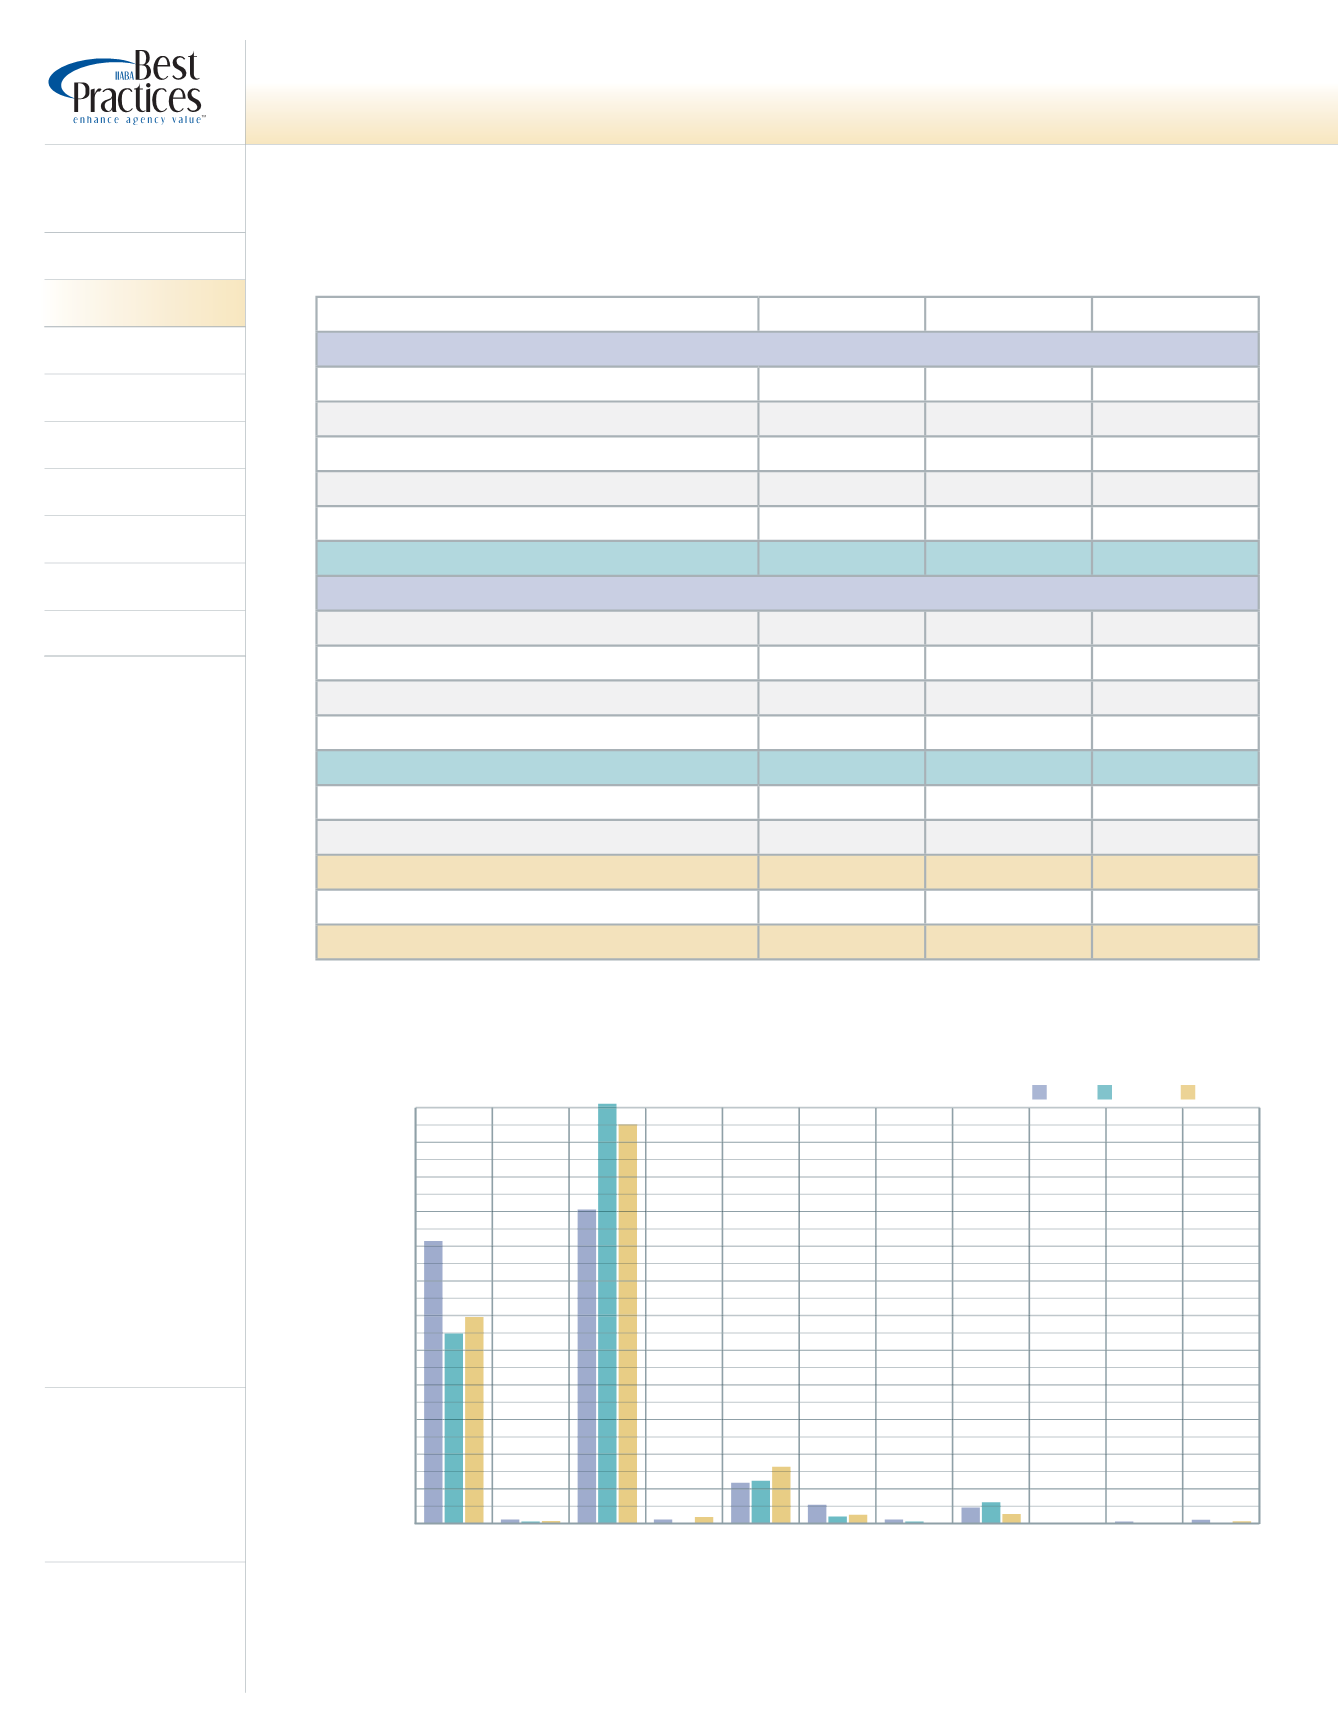
Revenues
Revenue by Source
(% of Gross Revenues)
(% by Source)
Average
+25% Profit
+25% Growth
Property & Casualty
Commercial Commissions & Fees
41.2%
27.0%
29.6%
Bonds
0.4%
0.1%
0.2%
Personal Commissions
45.2%
60.9%
57.6%
Value Added Services
0.4%
0.0%
1.0%
Contingent/Bonus
6.2%
6.8%
8.1%
Total P&C
93.5%
94.8%
96.5%
Life & Health/Financial
Group Medical Commissions & Fees
3.0%
1.0%
1.4%
All Other Group Commissions & Fees
0.4%
0.1%
0.0%
Individual L&H Commissions & Fees
2.6%
4.1%
1.6%
Bonus/Overrides
0.0%
0.0%
0.2%
Total L&H/Financial
6.1%
5.1%
3.3%
Investments
0.1%
0.0%
0.0%
Miscellaneous
0.3%
0.0%
0.2%
Gross Revenues
100.0%
100.0%
100.0%
Brokerage Commission Expense
0.3%
0.2%
0.0%
Net Revenues
99.7%
99.8%
100.0%
% Total Revenue
10.0%
20.0%
30.0%
40.0%
50.0%
60.0%
0.0%
P&C
Contingent/
Bonus
P&C
VAS
Fees
P&C
Personal
Comm
& Fees
P&C
Bonds
Comm
& Fees
P&C
Commercial
Comm
& Fees
L&H
Group
Medical
Comm
& Fees
L&H
All Other
Group
Comm
& Fees
L&H
Individual
Comm
& Fees
L&H
Bonus/
Overrides
Investments Miscellaneous
Average
+25% Profit
+25% Growth