


 6 / 155

Key Benchmarks
Profile
Revenues
Expenses
Profitability
Employee Overview
Producer Info
Staff Service Info
Technology
Insurance Carriers
Appendix
6
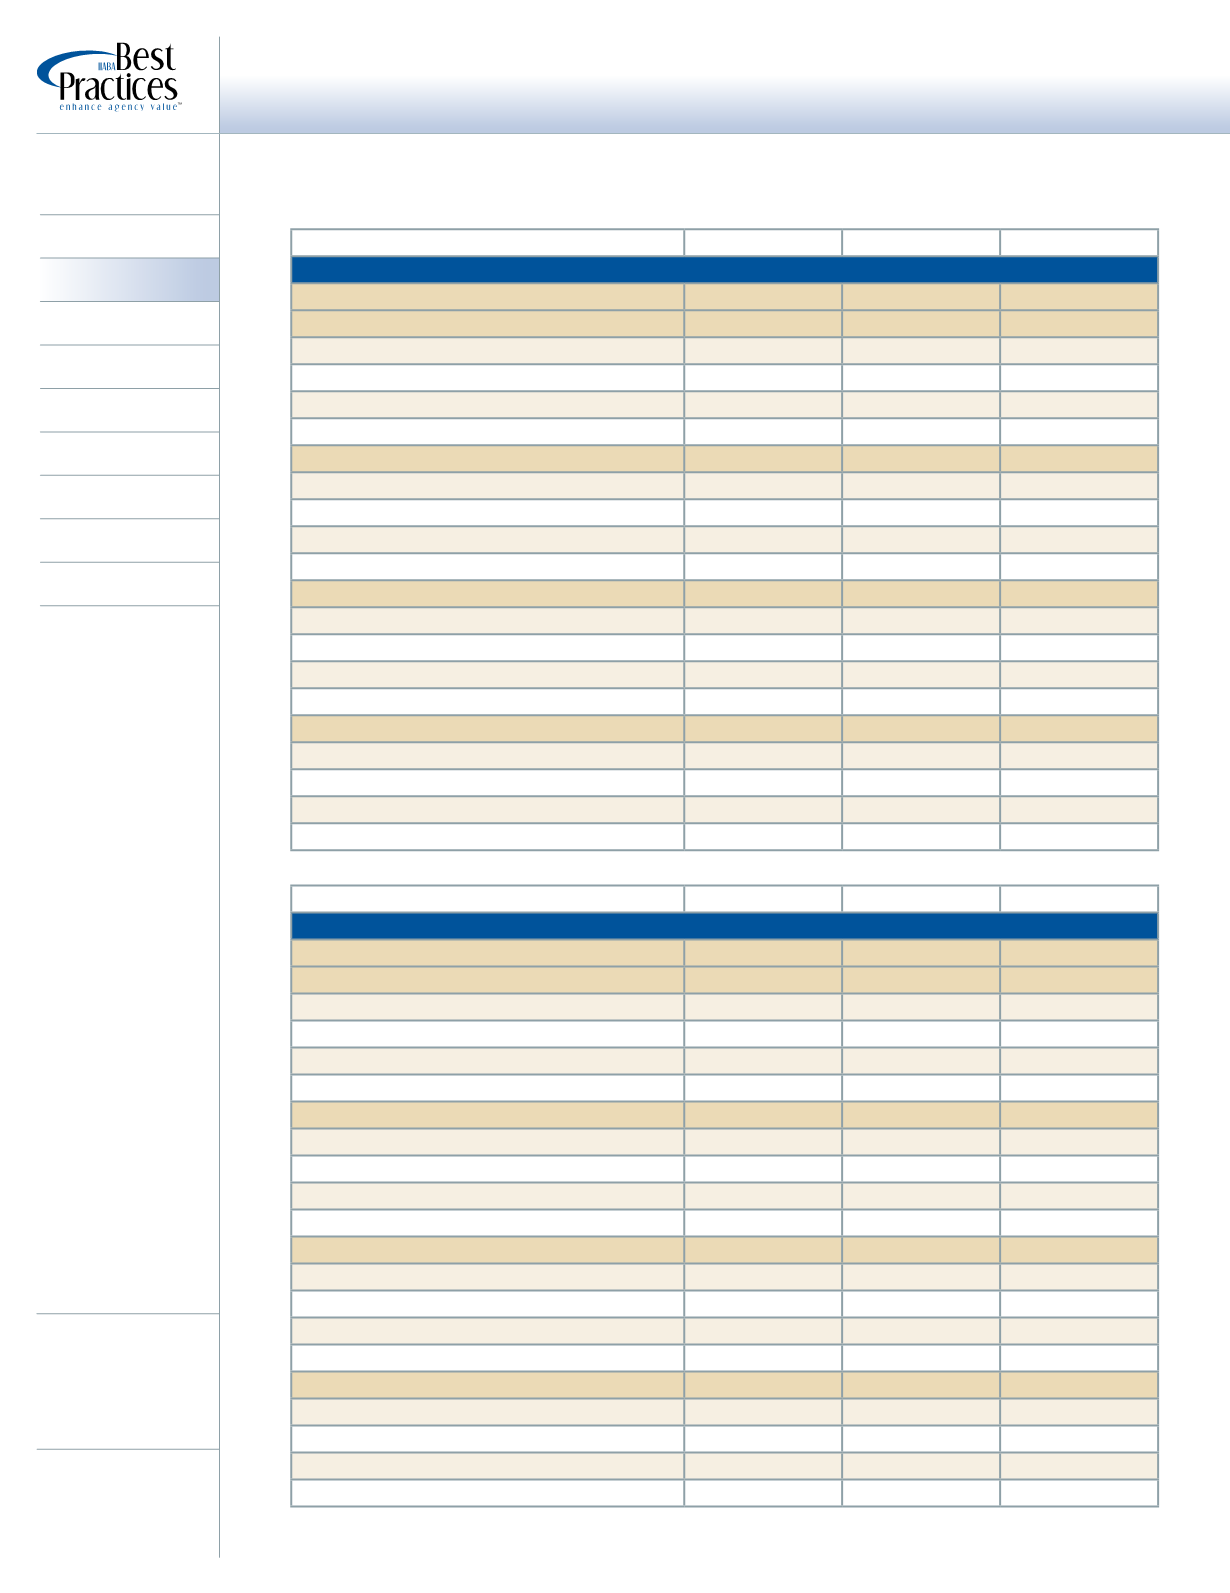
Analysis of Agencies with Revenues Under $1,250,000
2012 Best
Practices Study
Agencies with
Revenues
Under
$1,250,000
Revenue by Account Size
(as measured by Comm. & Fees – not premium)
Average
+25% Profit
+25% Growth
Commercial P&C
Total Commissions & Fees in Book
$394,568
$350,335
$413,955
Greater than $25,000
% of Book
6.1%
5.2%
13.0%
# of Accounts
1.7
1.5
2.3
Total Revenue
$67,840
$63,261
$107,426
Revenue per Account
$39,906
$42,174
$46,040
Between $10,000 and $25,000
% of Book
20.1%
19.5%
14.0%
# of Accounts
7.6
9.5
4.6
Total Revenue
$105,782
$119,583
$69,460
Revenue per Account
$13,884
$12,588
$15,100
Between $5,000 and $10,000
% of Book
15.9%
20.2%
15.1%
# of Accounts
13.3
17.2
11.6
Total Revenue
$79,837
$99,153
$75,005
Revenue per Account
$6,015
$5,765
$6,466
Less than $5,000
% of Book
57.9%
55.1%
57.9%
# of Accounts
610.6
347.2
716.6
Total Revenue
$236,729
$225,288
$287,826
Revenue per Account
$399
$649
$402
(as measured by number of lives)
Average
+25% Profit
+25% Growth
Group L&H/Financial
Total Commissions & Fees in Book
$112,716
$210,734
$86,465
Over 100 Lives
% of Book
4.4%
3.6%
10.2%
# of Accounts
1.0
1.0
1.0
Total Revenue
$22,359
$26,500
$26,500
Revenue per Account
$22,359
$26,500
$26,500
Between 50-100 Lives
% of Book
5.6%
4.7%
13.5%
# of Accounts
2.3
3.0
3.0
Total Revenue
$28,154
$35,000
$35,000
Revenue per Account
$12,513
$11,667
$11,667
Between 25-50 Lives
% of Book
8.9%
5.1%
12.4%
# of Accounts
5.0
7.5
9.3
Total Revenue
$22,478
$18,813
$21,417
Revenue per Account
$4,496
$2,508
$2,295
Under 25 Lives
% of Book
81.2%
86.6%
63.9%
# of Accounts
78.4
146.4
31.7
Total Revenue
$96,883
$182,412
$55,256
Revenue per Account
$1,236
$1,246
$1,745