


 2 / 44

waste
waste
Energy
production
waste
Construction
Demolition
800
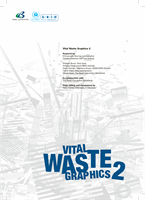
Waste
at every stage
waste
Water
purification
waste
Forestry
Agriculture
900
100
100
600
waste
1000
Manuf-
acturing
Mining
waste
600
Municipal
300
Sewage
sludge
Source: OECD, 2006 (estimates for 2002).
The squares are proportionnal to the estimated amounts of waste generated by sector in 2002,
in the OECD countries (in million tonnes).
Waste is produced from the very beginning of the life cycle of a product,
long before we as consumers are aware of it.
Waste is a complex and sometimes controversial issue. Good business for
some, a bothersome problem for others and a threat to health for yet an-
other category of people. Obtaining reliable data on waste is a difficult un-
dertaking. Definitions vary across countries, so does reporting discipline.
Despite efforts by international organisations to facilitate comparison by
providing standardised questionnaires for reporting waste quantities, cau-
tion is required when singling out possible “culprits”. Perhaps they were
just more diligent in their reporting? Numbers are also a way to fight for a
political cause, and can always be read in different ways.
For Vital Waste Graphics we use data from various sources: NGOs, international organisations, the
official Basel Convention database, specialised publications and scientific research.
Data on several waste types is subject to estimation. Expert opinions differ considerably when it
comes to the estimation of total amount of a specific waste type and its share of total waste. This
might result in potentially contradictory statements even within this publication.
Realising the controversy the choice of a certain dataset may cause, we ask our readers to bear in
mind the above and display understanding. The aim is to describe phenomena and pinpoint trends,
not to accuse individuals or countries.
As data collection systems, definitions and reporting discipline improve over time, so too will the
quality and usefulness of our publication, and thus the quality of the debate it informs. In the mean-
time, we hope you will enjoy this work, join in debate and think about how you can contribute to
rising to the global waste challenge.
!
DATA WARNING
HANDLE WITH CARE!
0
1400
1300
1200
1100
1000 BC
2000 BC
3000 BC
1500
1220
500 B.C.
1185
1388 1400
1506
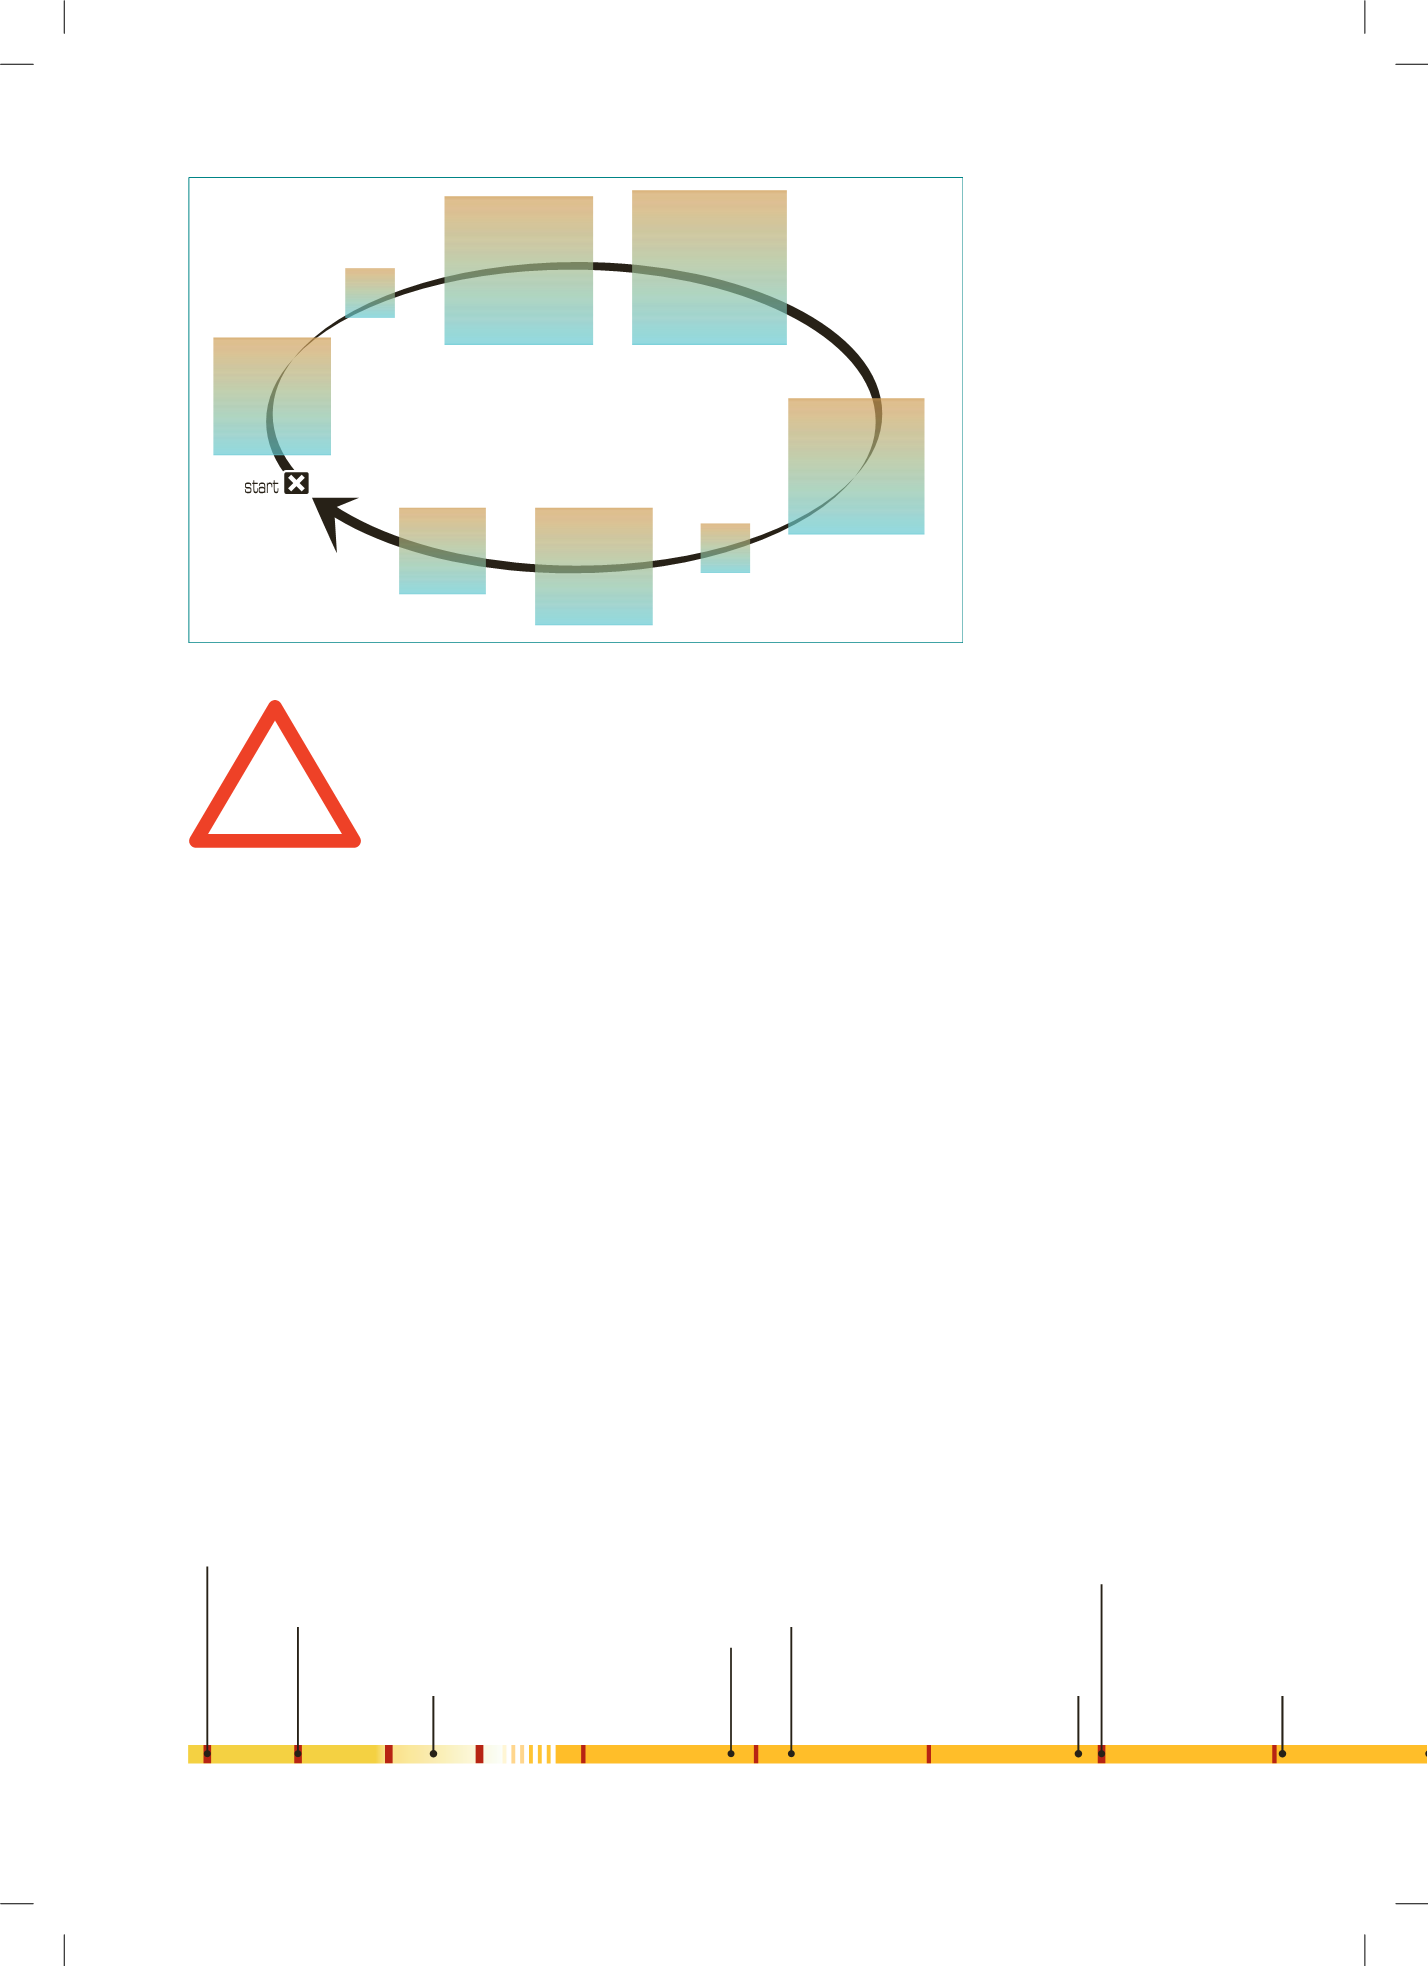
In Athens waste is carried away
to municipal dumps at least a mile
outsided the city gates
First recorded landfill created in Knossos, the Cretan capital,
where waste is buried in large pits
Dumping of waste
from windows forbidden
in Paris, France
Composting already
a common practice in China
In Naples, Italy, "who deposits muck
or debris at other than the
designated places is to be seized
and sent on a galley or be whipped
across the whole city”.
o
F
a
English parliament bans
waste disposal in public
waterways and ditches
Waste piles up so high outside
Paris gates that it interferes with
city’s defences
In France Louis XII
decides to organise
waste collection
A history of waste management
in selected anecdotes
Sources: US Environmental Protection Agency; National Energy Education Development Project, Museum of Solid Waste, 2006; Ecollect, 2006; Waste online, 2006; Environment Switzerland 2000; Stadtreiningung Hamburg.