


 16-17 / 158

UPM Annual Report 2015
UPM Annual Report 2015
13
14
contents
UPM aims to increase shareholder value
Drive top performance:
At the business area level, UPM targets top performance in
their respective markets. In 2015, out of our six business areas, UPMBiorefining, UPM
Plywood and UPMEnergy exceeded their long-term return targets, and UPMRaflatac
showed good improvement, getting very close to its target. (page 12). UPM is committed
to continuous improvement in its financial, social and environmental performance.
1
Capture growth opportunities:
To expand the well-performing businesses with
promising long term fundamentals, UPM is implementing focused growth projects.
In 2016, several growth projects are ramping up and focus turns to reaping the benefits
from the investments.
2
Develop business portfolio:
UPM is seeking to develop its business portfolio in
order to uncover and increase its value. Increasing the share of highly profitable busi-
nesses with good fundamentals for growth improves the company’s long-term profit
ability and boosts the value of the shares.
3
Innovation:
UPM’s expertise in renewable and recyclable materials, low-emission
energy and resource efficiency is the key to developing new, sustainable business oppor-
tunities with high added value.
4
Strong operating cash flow
is important for UPM as it enables the realisation of
organic growth projects and new business development, as well as paying attractive
dividends to UPM shareholders.
1
2
3
4
Industry leading balance sheet:
The company aims to maintain a strong balance
sheet to enable portfolio changes that increase UPM’s shareholder value.
1
2
3
4
Responsibility
is an integral part of UPM’s Biofore strategy. Good governance,
industry-leading environmental performance, responsible sourcing practices and
a safe working environment are important sources of competitive advantage. Proactive
corporate responsibility work also enables business impacts and risks to be efficiently
identified and mitigated. UPM’s consistent efforts in this area continued to gain external
recognition in 2015.
1
Dividend policy
Attractive dividend:
UPM aims to pay an attractive dividend, 30-40% of the
company’s annual operating cash flow per share.
UPM aims to increase profitability,
growth outlook and value of
its business portfolio. The target is
to develop the business portfolio
to uncover and increase its value.
With good performance in the
businesses, strong cash flow,
and leading balance sheet in the
industry, UPM can simultaneously
distribute an attractive dividend,
implement focused growth projects
and act on strategic opportunities.
IN BRIEF
STRATEGY
BUSINESSES
GOVERNANCE
STAKEHOLDERS
ACCOUNTS
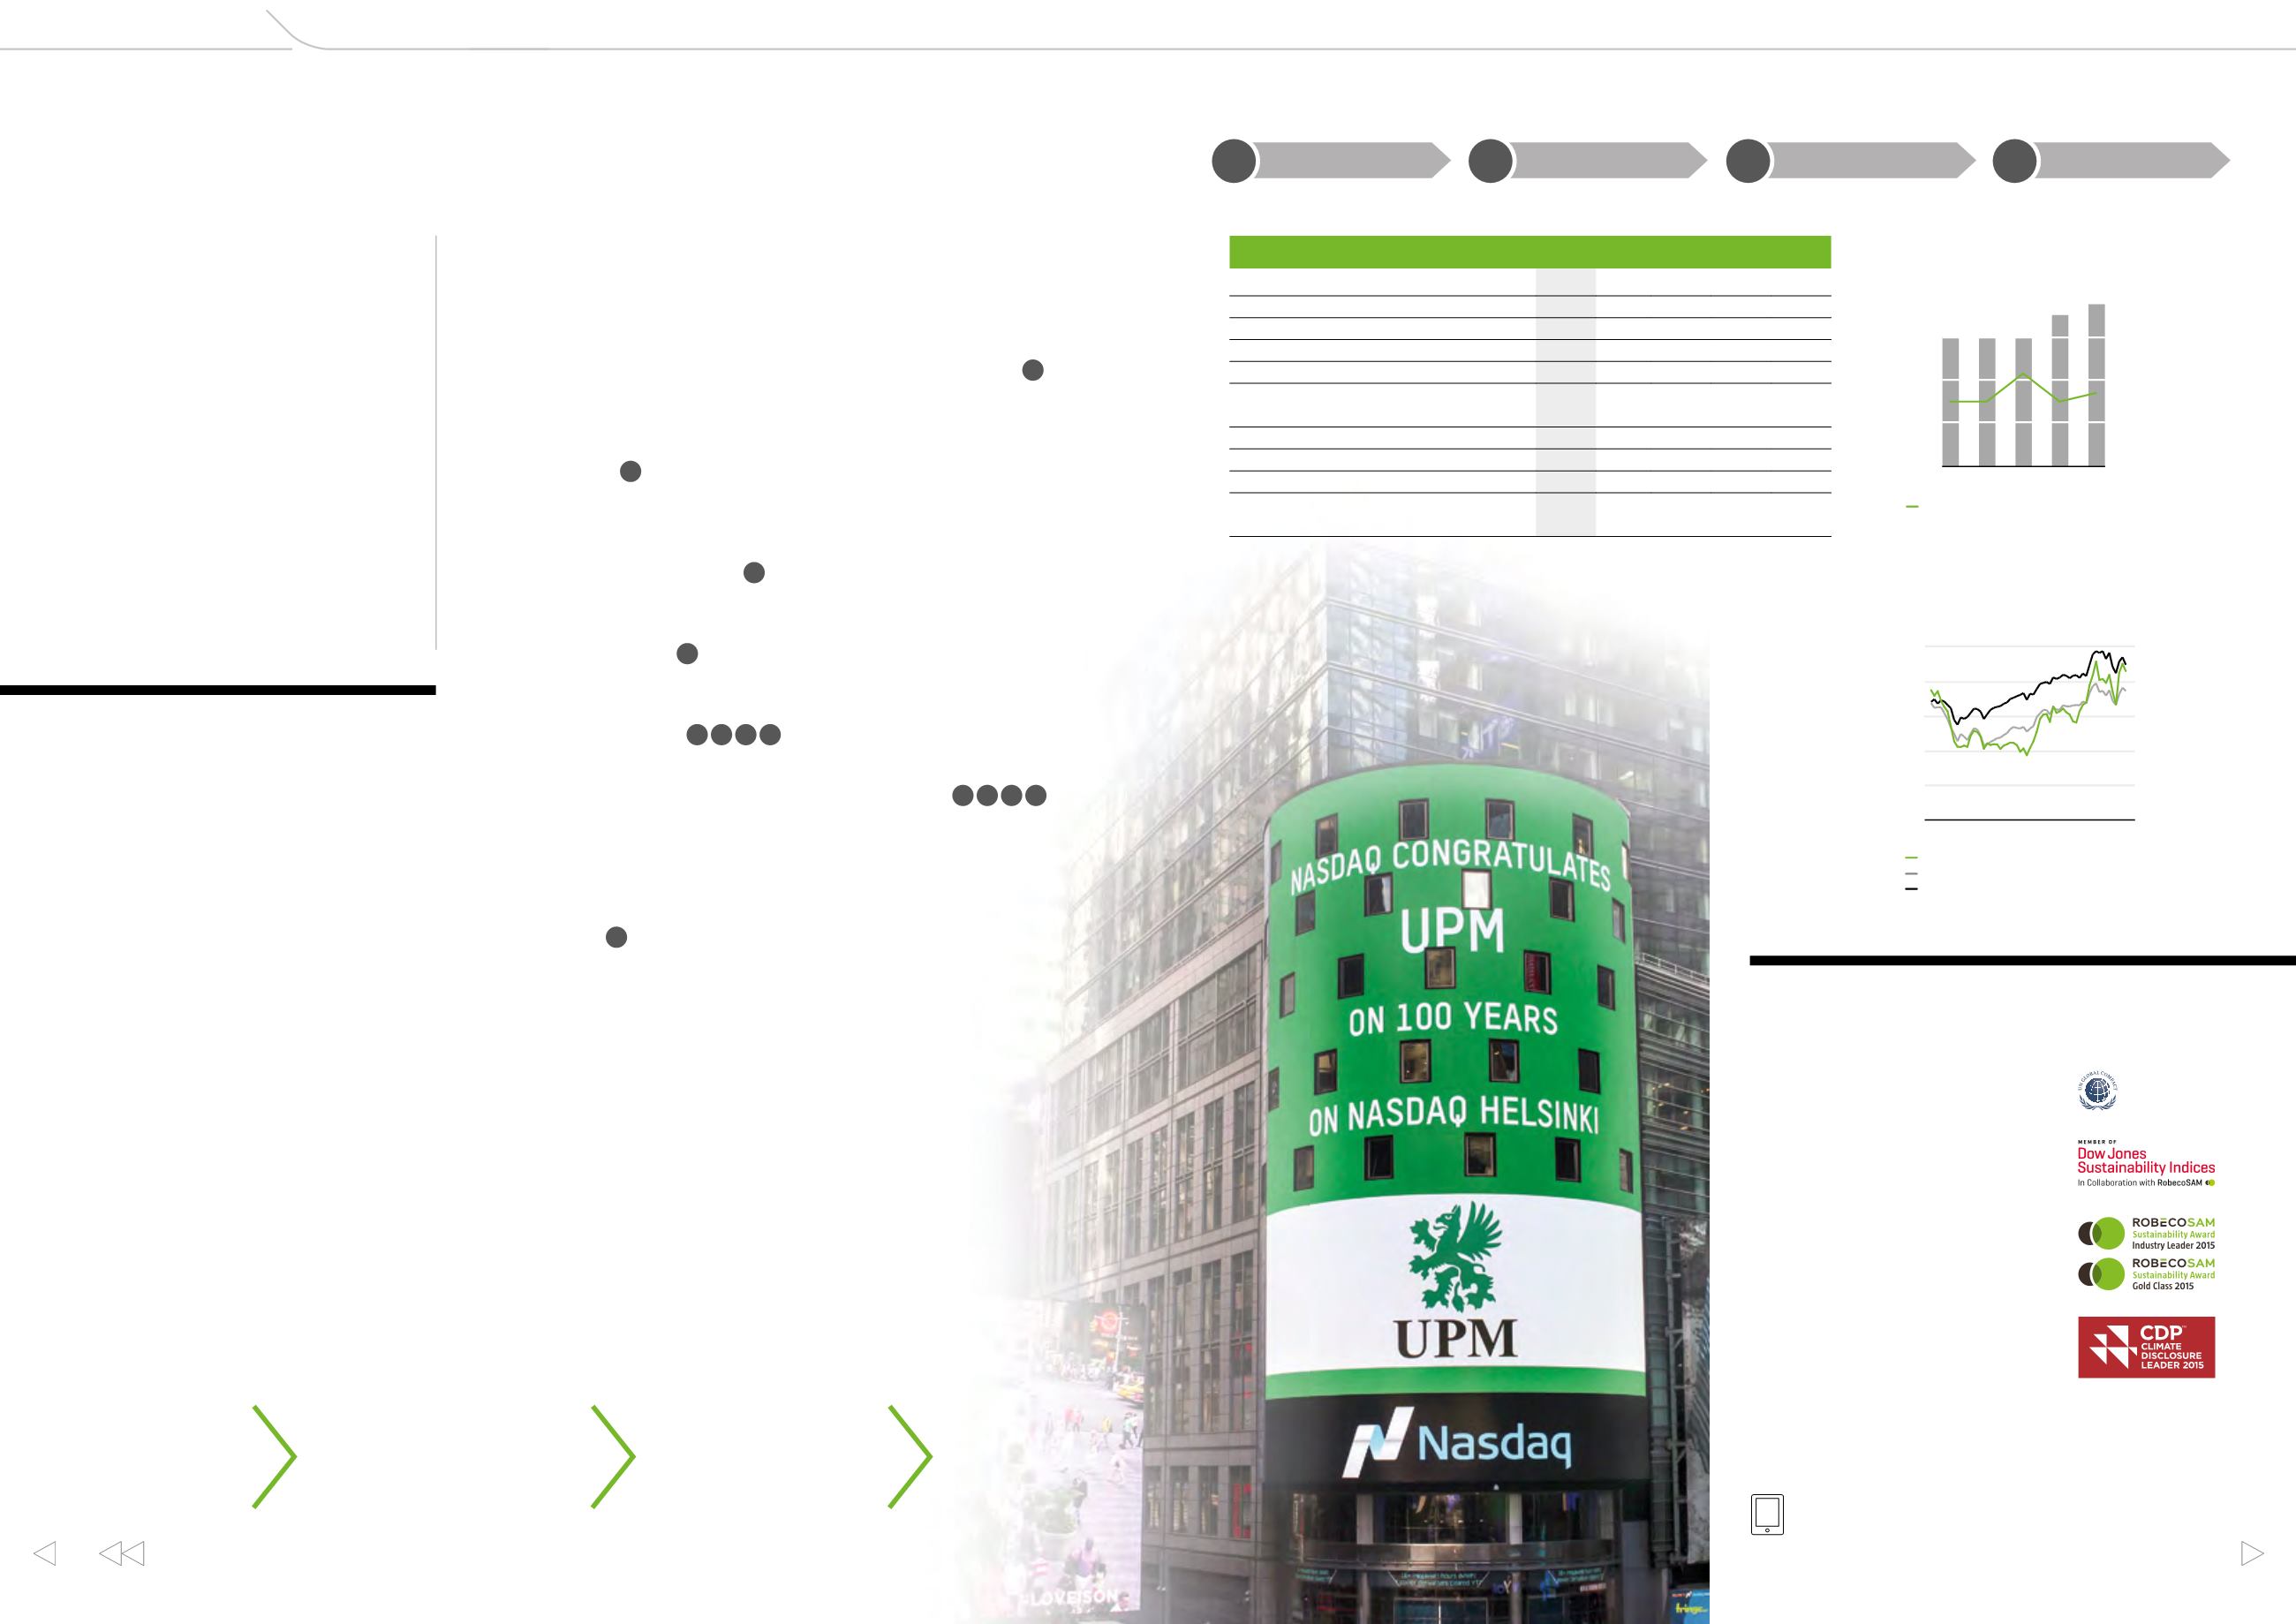
UPM as an investment
UPM share price 2011–2015
compared with indices
EUR
UPM share price
NASDAQ OMX Helsinki (rebased)
DJ STOXX 600 (rebased)
2011 2012 2013 2014 2015
0
4
8
12
16
20
5-year share performance and valuation multiples
2015
2014
2013 2012 2011
Share price at 31 Dec, EUR
17.23
13.62
12.28 8.81 8.51
Earnings per share, excluding special items, EUR
1.75
1.17
0.91 0.74 0.93
Dividend per share, EUR
0.75
*
)
0.70
0.60 0.60 0.60
Operating cash flow per share, EUR
2.22
2.33
1.39 1.98 1.99
Effective dividend yield, %
4.4
5.1
4.9 6.8 7.1
P/E ratio
10.0
14.2
19.5 neg.
9.7
P/BV ratio
1)
1.16
0.97
0.87 0.62 0.60
EV/EBITDA ratio
2)
8.4
7.5
8.3 6.0 5.8
Market capitalisation, EUR million
9,192
7,266
6,497 4,633 4,466
*)
2015: Board’s proposal
1)
P/BV ratio = Share price at 31.12./Equity per share
2)
EV/EBITDA ratio = (Market capitalisation + Net debt)/EBITDA
UPM invited into UN Global Compact LEAD
as the first forest industry company and
the first Finnish Company as of 1 Jan 2016
Industry leader in the Dow Jones European
and World Sustainability Indices for
2015–2016
RobecoSAM’s annual Sustainability
Yearbook 2015 with Industry Leader and
Golden Class distinctions
CDP Nordic Disclosure Leadership Index
the 7th time in a row
Number 25 in the 2016 Global 100 Most
Sustainable Corporations in the World
(Global 100)
Recognition by FAO for exemplary forestry
in Uruguay
Read more:
www.upm.com/responsibilityUPM’s Biofore strategy receives
external recognition
Vision and values
Portfolio strategy
Business targets
Capital allocation
Code of Conduct
Responsibility targets
Top performance
Competitive advantage
Value creation
Shared value with stakeholders
License to operate
Business area strategies
Commercial excellence
Growth projects
Profitability improvement programmes
Innovation
GROUP
IMPLEMENTATION IN BUSINESSES
OUTCOMES
Over the past years, UPMhas transformed from an integrated paper
company into a Biofore company with six separate business areas,
each striving for top performance in their respective markets. UPM
has turned former internal resources such as chemical pulp and
energy into customer-focused and market-driven businesses, created
new business in advanced biofuels and grown in its other well-per-
forming businesses. The company’s profitability has improved, share-
holder returns have increased and the balance sheet has been
strengthened (see page 4).
Global Compact
LEAD
Each business area is responsible for executing its own strategy and
achieving targets. Group direction and support from global functions
enable the businesses to capture benefits fromUPM’s brand, scale and
integration, while navigating the complex operating environment.
UPM’s structure of six separate businesses enables optimal capital
allocation decisions at the group level, as well as developing the busi-
ness portfolio further.
With the Biofore strategy (on page 5), we are committed to continue
the transformation. A strong focus on performance and competitive-
ness, combined with an industry leading balance sheet, demonstrate
our ability to execute it.
Driving performance and transformation
15
14
13
12
11
0.80
0.60
0.40
0.20
0.00
% of operating cash flow per share
Cash flow-based dividend
EUR per share
%
*)
Board’s proposal for 2015
80
60
40
20
0
0.75
*
)
1
performance
2
growth
3
PORTFOLIO
4
innovation