


 250 / 260

Police Operations and Data Analysis Report, Morgan Hill, California
112
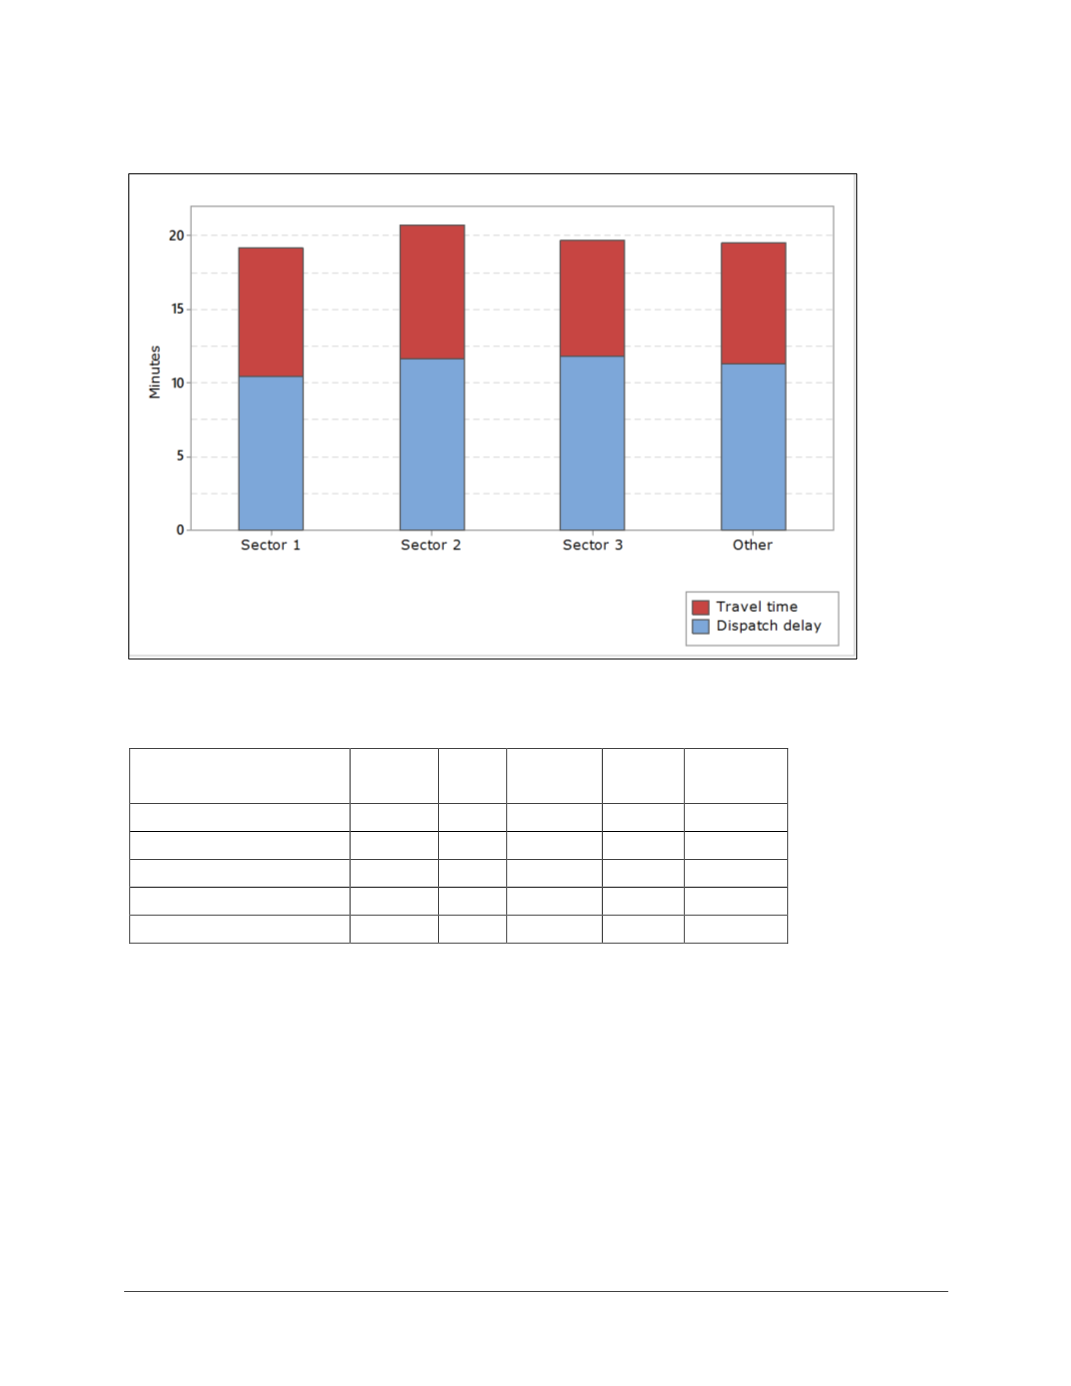
FIGURE 8-30: Average Response Time Components, by Zone
Note:
These averages reflect all calls with valid response times for the study period―a total of 8,209 calls.
TABLE 8-18: Average Response Time Components, by Zone
Zone
Dispatch Travel Response
Calls
Area
(Sq. Miles)
Sector 1
10.4
8.8
18.5
1,673
3.9
Sector 2
11.6
9.1
19.6
1,947
5.9
Sector 3
11.8
7.8
18.8
2,529
3.0
Other
11.3
8.2
18.7
2,060
NA
Weighted Average/ Total
11.3
8.4
18.9
8,210
12.9
Observations:
The average response time varied between 18.5 and 19.6 minutes for all sectors within the
city.
The average response time for calls was shortest in Sector 1 and highest in Sector 2.