


 96-97 / 176

ACCOUNTS
UPM Annual Report 2016
UPM Annual Report 2016
96
97
In brief
Strategy
Businesses
Stakeholders
Governance
Accounts
CONTENTS
Other operations
2016
2015
Sales, EURm
285
406
Comparable EBITDA, EURm
–35
–16
Change in fair value of forest assets and wood
harvested, EURm
59
331
Share of results of associates and joint
ventures, EURm
3
1
Depreciation, amortisation and impairment
charges, EURm
–13
–13
Operating profit, EURm
15
306
Items affecting comparability in operating
profit, EURm
1)
1
268
Comparable EBIT, EURm
14
38
Capital employed (average), EURm
1,541
1,483
Comparable ROCE, %
0.9
2.6
1)
In 2016, items affecting comparability relate to restructuring charges. In 2015,
items affecting comparability include a fair value increase of forest assets
in Finland totalling EUR 265 million, due to adjusted long-term wood price
estimates and a change in discount rate. In addition, capital gains of EUR 3
million from the sale of Tilhill Forestry Ltd shares, capital gains of EUR 3 million
from the sale of other assets and EUR 3 million of restructuring charges were
reported as items affecting comparability.
2016 compared with 2015
Comparable EBIT for Other operations decreased. The increase in the
fair value of biological assets net of wood harvested, excluding items
affecting comparability, was EUR 59 million (66 million). The increase
in the fair value of biological assets (growing trees), excluding items
affecting comparability, was EUR 113 million (112 million), including
gains on forest sales. The cost of wood harvested from UPM forests
was EUR 54 million (46 million).
In 2016, UPM sold a total of 63,113 (63,669) hectares of forests.
Shares
UPM has one class of shares. Each share entitles the holder to one
vote at the Annual General Meeting of UPM.
On December 31, 2016 the total number of UPM shares was
533,735,699. Through the issuance authorisation described below,
the number of shares may increase to a maximum of 558,735,699.
On December 31, 2016, UPM held 230,737 of its own shares,
representing approximately 0.04% of the total number of UPM shares
and voting rights. There are no specific terms related to the shares
except for the redemption clause described below.
In 2016, UPM shares worth EUR 6,749 million (EUR 7,469 million)
in total were traded on the NASDAQ Helsinki. This is estimated to
represent about two thirds of all trading volumes in UPM shares.
The highest listing was EUR 23.41 in December and the lowest EUR
13.71 in February.
The company’s ADSs are traded on the US over-the-counter (OTC)
market under a Level 1-sponsored American Depositary Receipt
programme.
Information on the major shareholders, break-down by shareholders
category and size as well as share related indicators are available
in section
» Information on shares
in UPM Annual report 2016.
Redemption clause
Under § 12 of UPM-Kymmene Corporation’s Articles of Association,
a shareholder who, alone or jointly with another shareholder owns 33
1/3 percent or 50 percent or more of all the company’s shares or their
associated voting rights shall, at the request of other shareholders,
be liable to redeem their shares and any securities that, under the
Companies Act, carry the right to such shares, in the manner
prescribed in § 12.
A resolution of a general meeting of shareholders to amend or
delete this redemption clause must be carried by shareholders
representing not less than three-quarters of the votes cast and shares
represented at the meeting.
Authorisations held by the Board of Directors
The Annual General Meeting held on 7 April 2016 authorised the
Board of Directors to decide on the repurchase of a maximum of
50,000,000 of the Company’s own shares. The authorisation will be
valid for 18 months from the date of the AGM resolution.
The Board of Directors was authorised to decide on the issuance
of new shares, transfer of treasury shares and issuance of special
rights entitling to shares in proportion to the shareholders’ existing
holdings in the Company, or in a directed share issue, deviating from
the shareholders’ pre-emptive subscription rights. The Board of
Directors may also decide on a share issue without payment to the
Company itself. The aggregate maximum number of new shares that
may be issued and treasury shares that may be transferred is
25,000,000, including also the number of shares that can be received
on the basis of the special rights. The authorisation will be valid for
three years from the date of the AGM resolution.
Aside from the above, the Board of Directors has no current
authorisation to issue shares, convertible bonds or share options.
Board of Directors and
the Group Executive Team
At the Annual General Meeting held on 7 April 2016, the number
of members of the Board of Directors was confirmed as ten, and all
former directors, i.e. Berndt Brunow, Henrik Ehrnrooth, Piia-Noora
Kauppi, Wendy E. Lane, Jussi Pesonen, Ari Puheloinen, Veli-Matti
Reinikkala, Suzanne Thoma, Kim Wahl and Björn Wahlroos, were
re-elected to the Board for a term continuing until the end of the next
AGM.
At the meeting of the Board of Directors held following the AGM,
Björn Wahlroos was re-elected as Chairman, and Berndt Brunow as
Deputy Chairman of the Board of Directors. In addition, the Board of
Directors elected the chairmen and other members to the Board
committees from among its members. No changes took place in the
committee compositions.
Shares held by the Board of Directors
and the Group Executive Team
At the end of the year, the members of the Board of Directors
including the President and CEO owned a total of 987,427 (882,101)
UPM-Kymmene Corporation shares. These represent 0.19% (0.16%)
of the shares and 0.19% (0.16%) of the voting rights. At the end of
the year, President and CEO Jussi Pesonen owned 304,064 shares.
At the end of the year, the other members of the Group Executive
Team owned a total of 360,170 shares.
» Refer Note 3.2
Key management personnel, of consolidated
financial statements 2016 for further information on remuneration
and shares held by the members of the Board, the President and CEO
and the members of Group Executive Team.
Litigation
» Refer Note 9.2
Litigation, of consolidated financial statements 2016
for information on legal proceedings.
2016
2015
Sales, EURm
444
439
Comparable EBITDA, EURm
80
78
% of sales
18.1
17.8
Depreciation, amortisation and impairment
charges, EURm
–22
–23
Operating profit, EURm
58
53
% of sales
13.2
12.1
Items affecting comparability in operating
profit, EURm
1)
–
–2
Comparable EBIT, EURm
58
55
% of sales
13.2
12.5
Capital employed (average), EURm
259
263
Comparable ROCE, %
22.6
20.9
Plywood deliveries, 1,000 m
3
764
740
1)
In 2015, items affecting comparability of EUR 2 million relate to Lahti estate
restructuring charges.
2016 compared with 2015
Comparable EBIT for UPM Plywood increased due to higher delivery
volumes and lower costs, partly supported by favourable currency
impact, more than offsetting the negative impact of slightly lower
sales prices.
Market environment
Market environment improved gradually during 2016 in Europe,
and demand is estimated to have increased from last year. Impact
of low-priced imports in the beginning of the year eased in Q2,
and since then, demand has picked up particularly in birch plywood-
related industrial applications.
Activity in the building and construction industry improved
somewhat. Market prices decreased at the beginning of the year,
butexperienced slight increases during the second half of the year.
UPM Plywood
UPM Plywood offers plywood and
veneer products, mainly for construction,
vehicle flooring and LNG shipbuilding,
as well as other manufacturing
industries. Production facilities are
located in Finland, Estonia and Russia.
Other operations include wood sourcing
and forestry, UPM Biocomposites and
UPM Biochemicals business units and
group services.
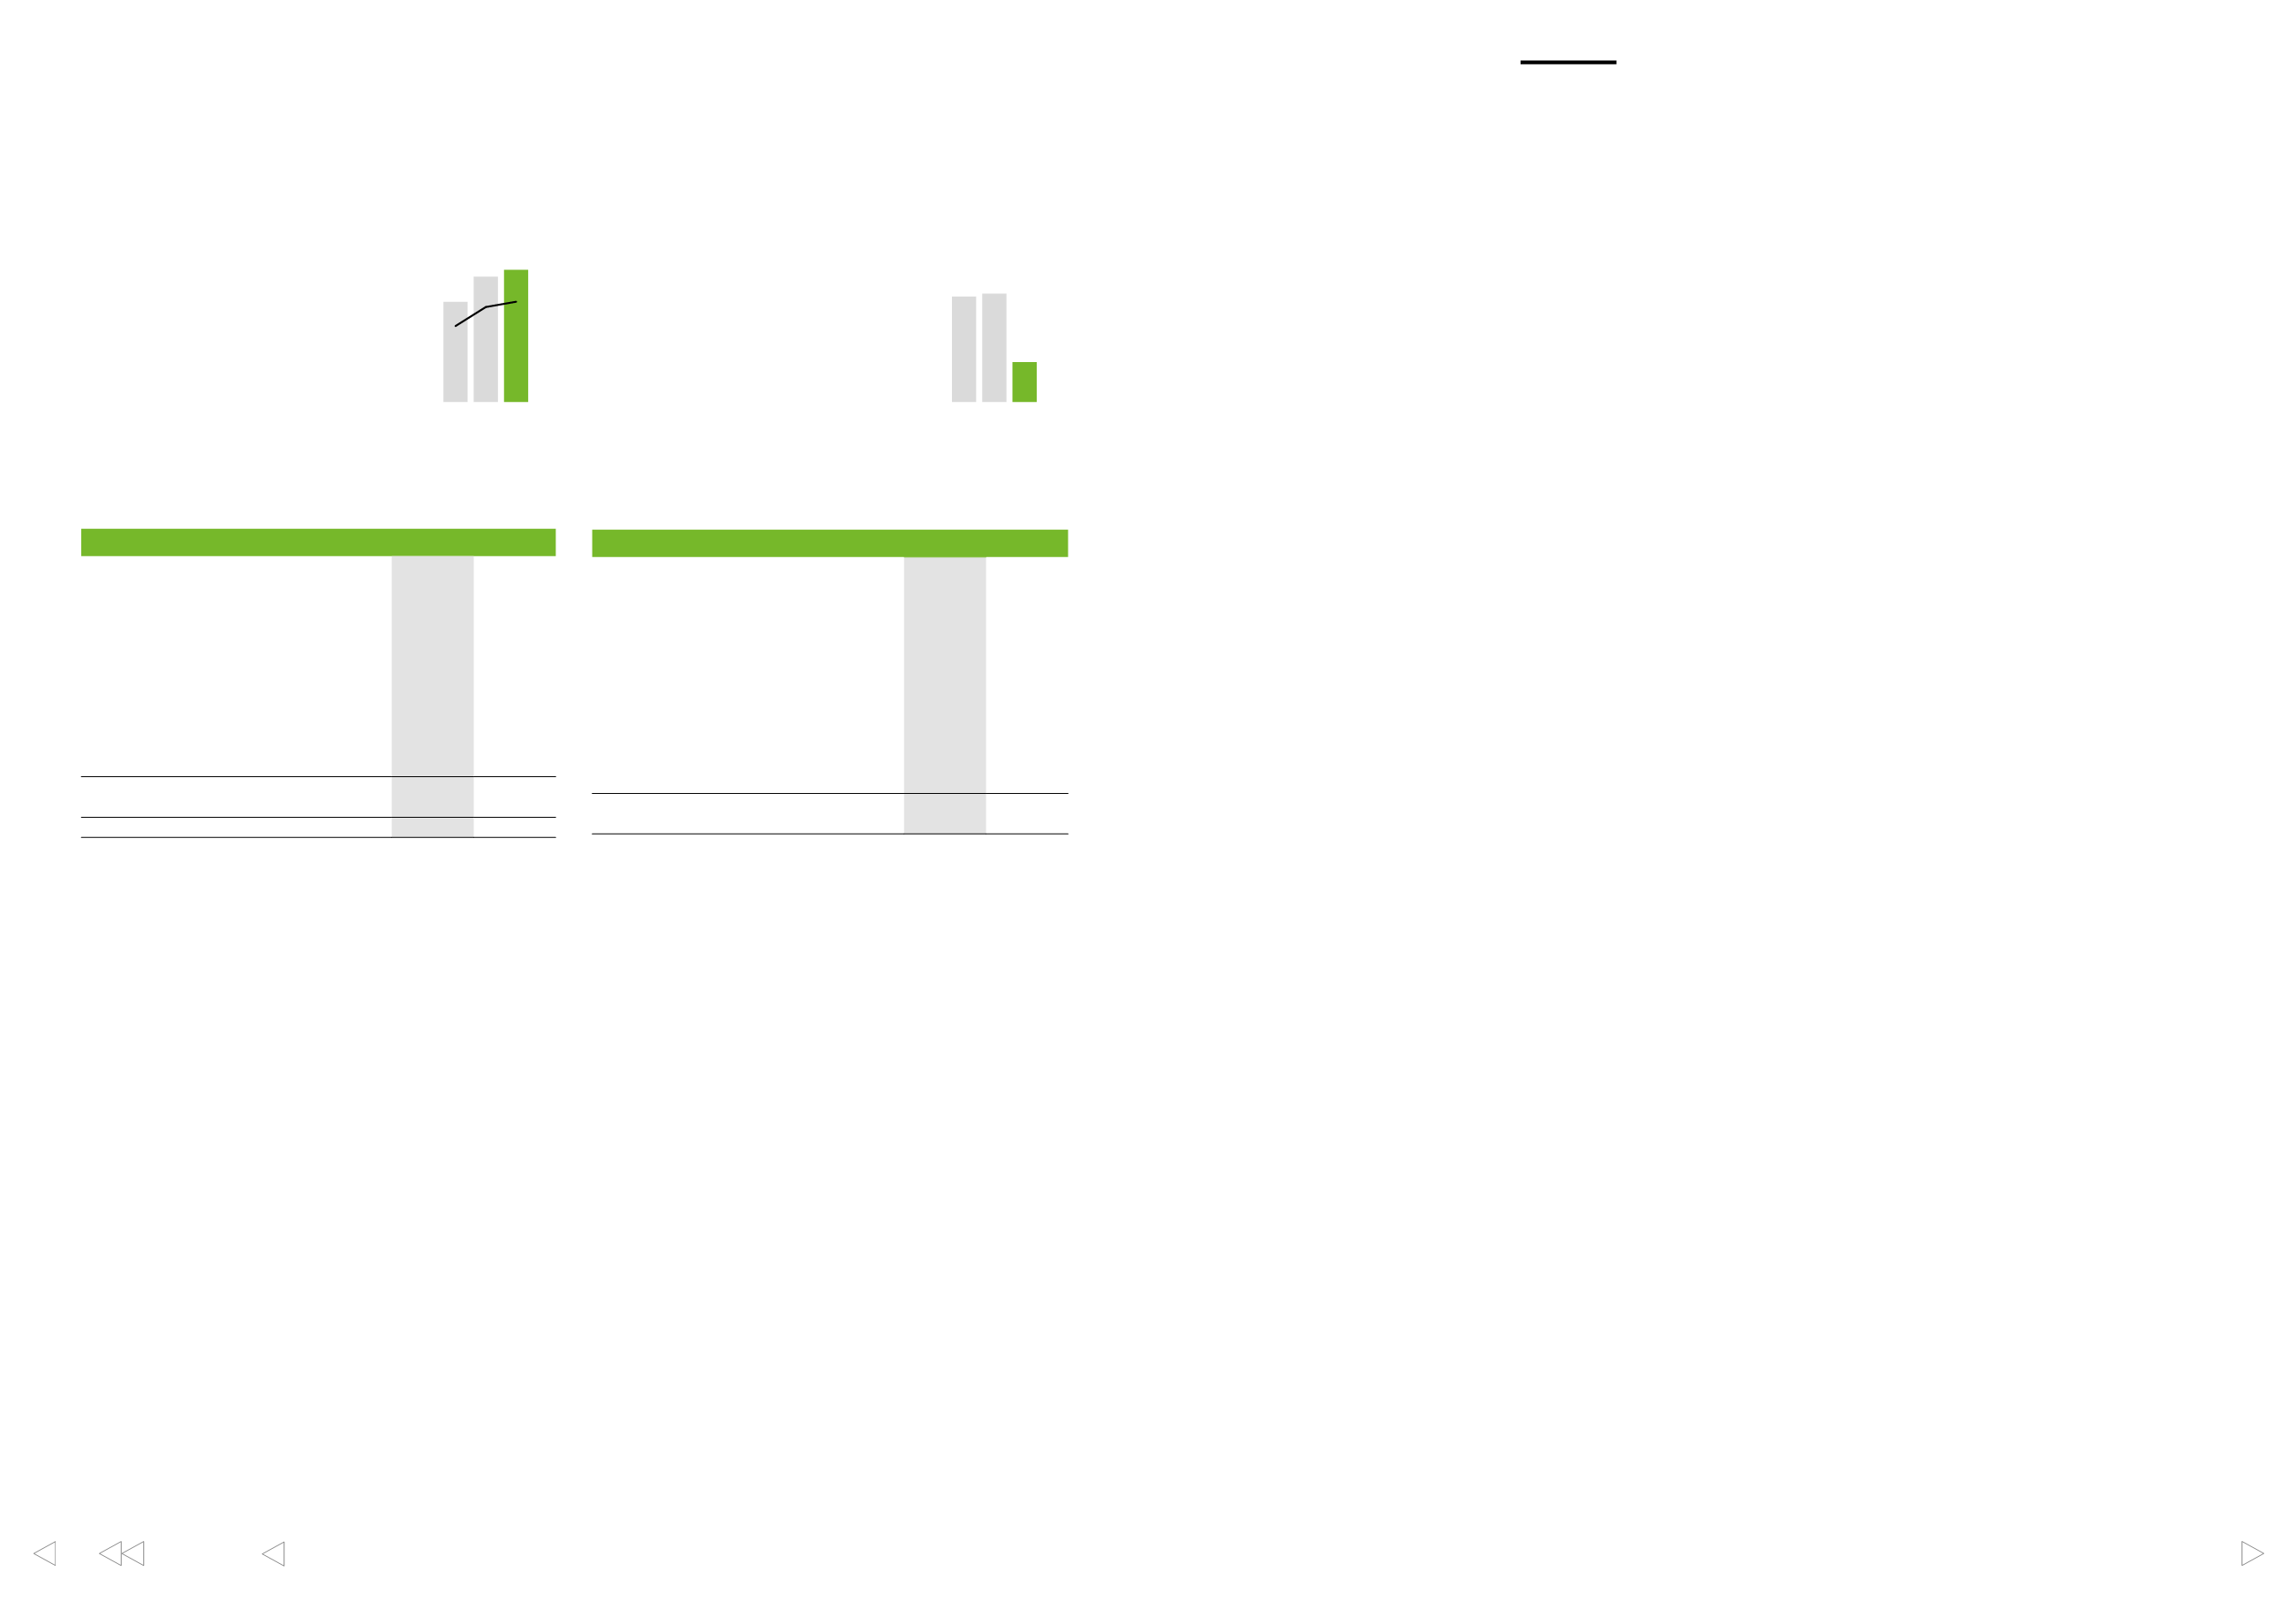
15 16
14
EURm
Comparable EBIT
% of sales
60
50
40
30
20
10
0
18
15
12
9
6
3
0
15 16
14
EURm
Comparable EBIT
48
40
32
24
16
8
0