
ACCOUNTS
UPM Annual Report 2016
UPM Annual Report 2016
104
105
In brief
Strategy
Businesses
Stakeholders
Governance
Accounts
CONTENTS
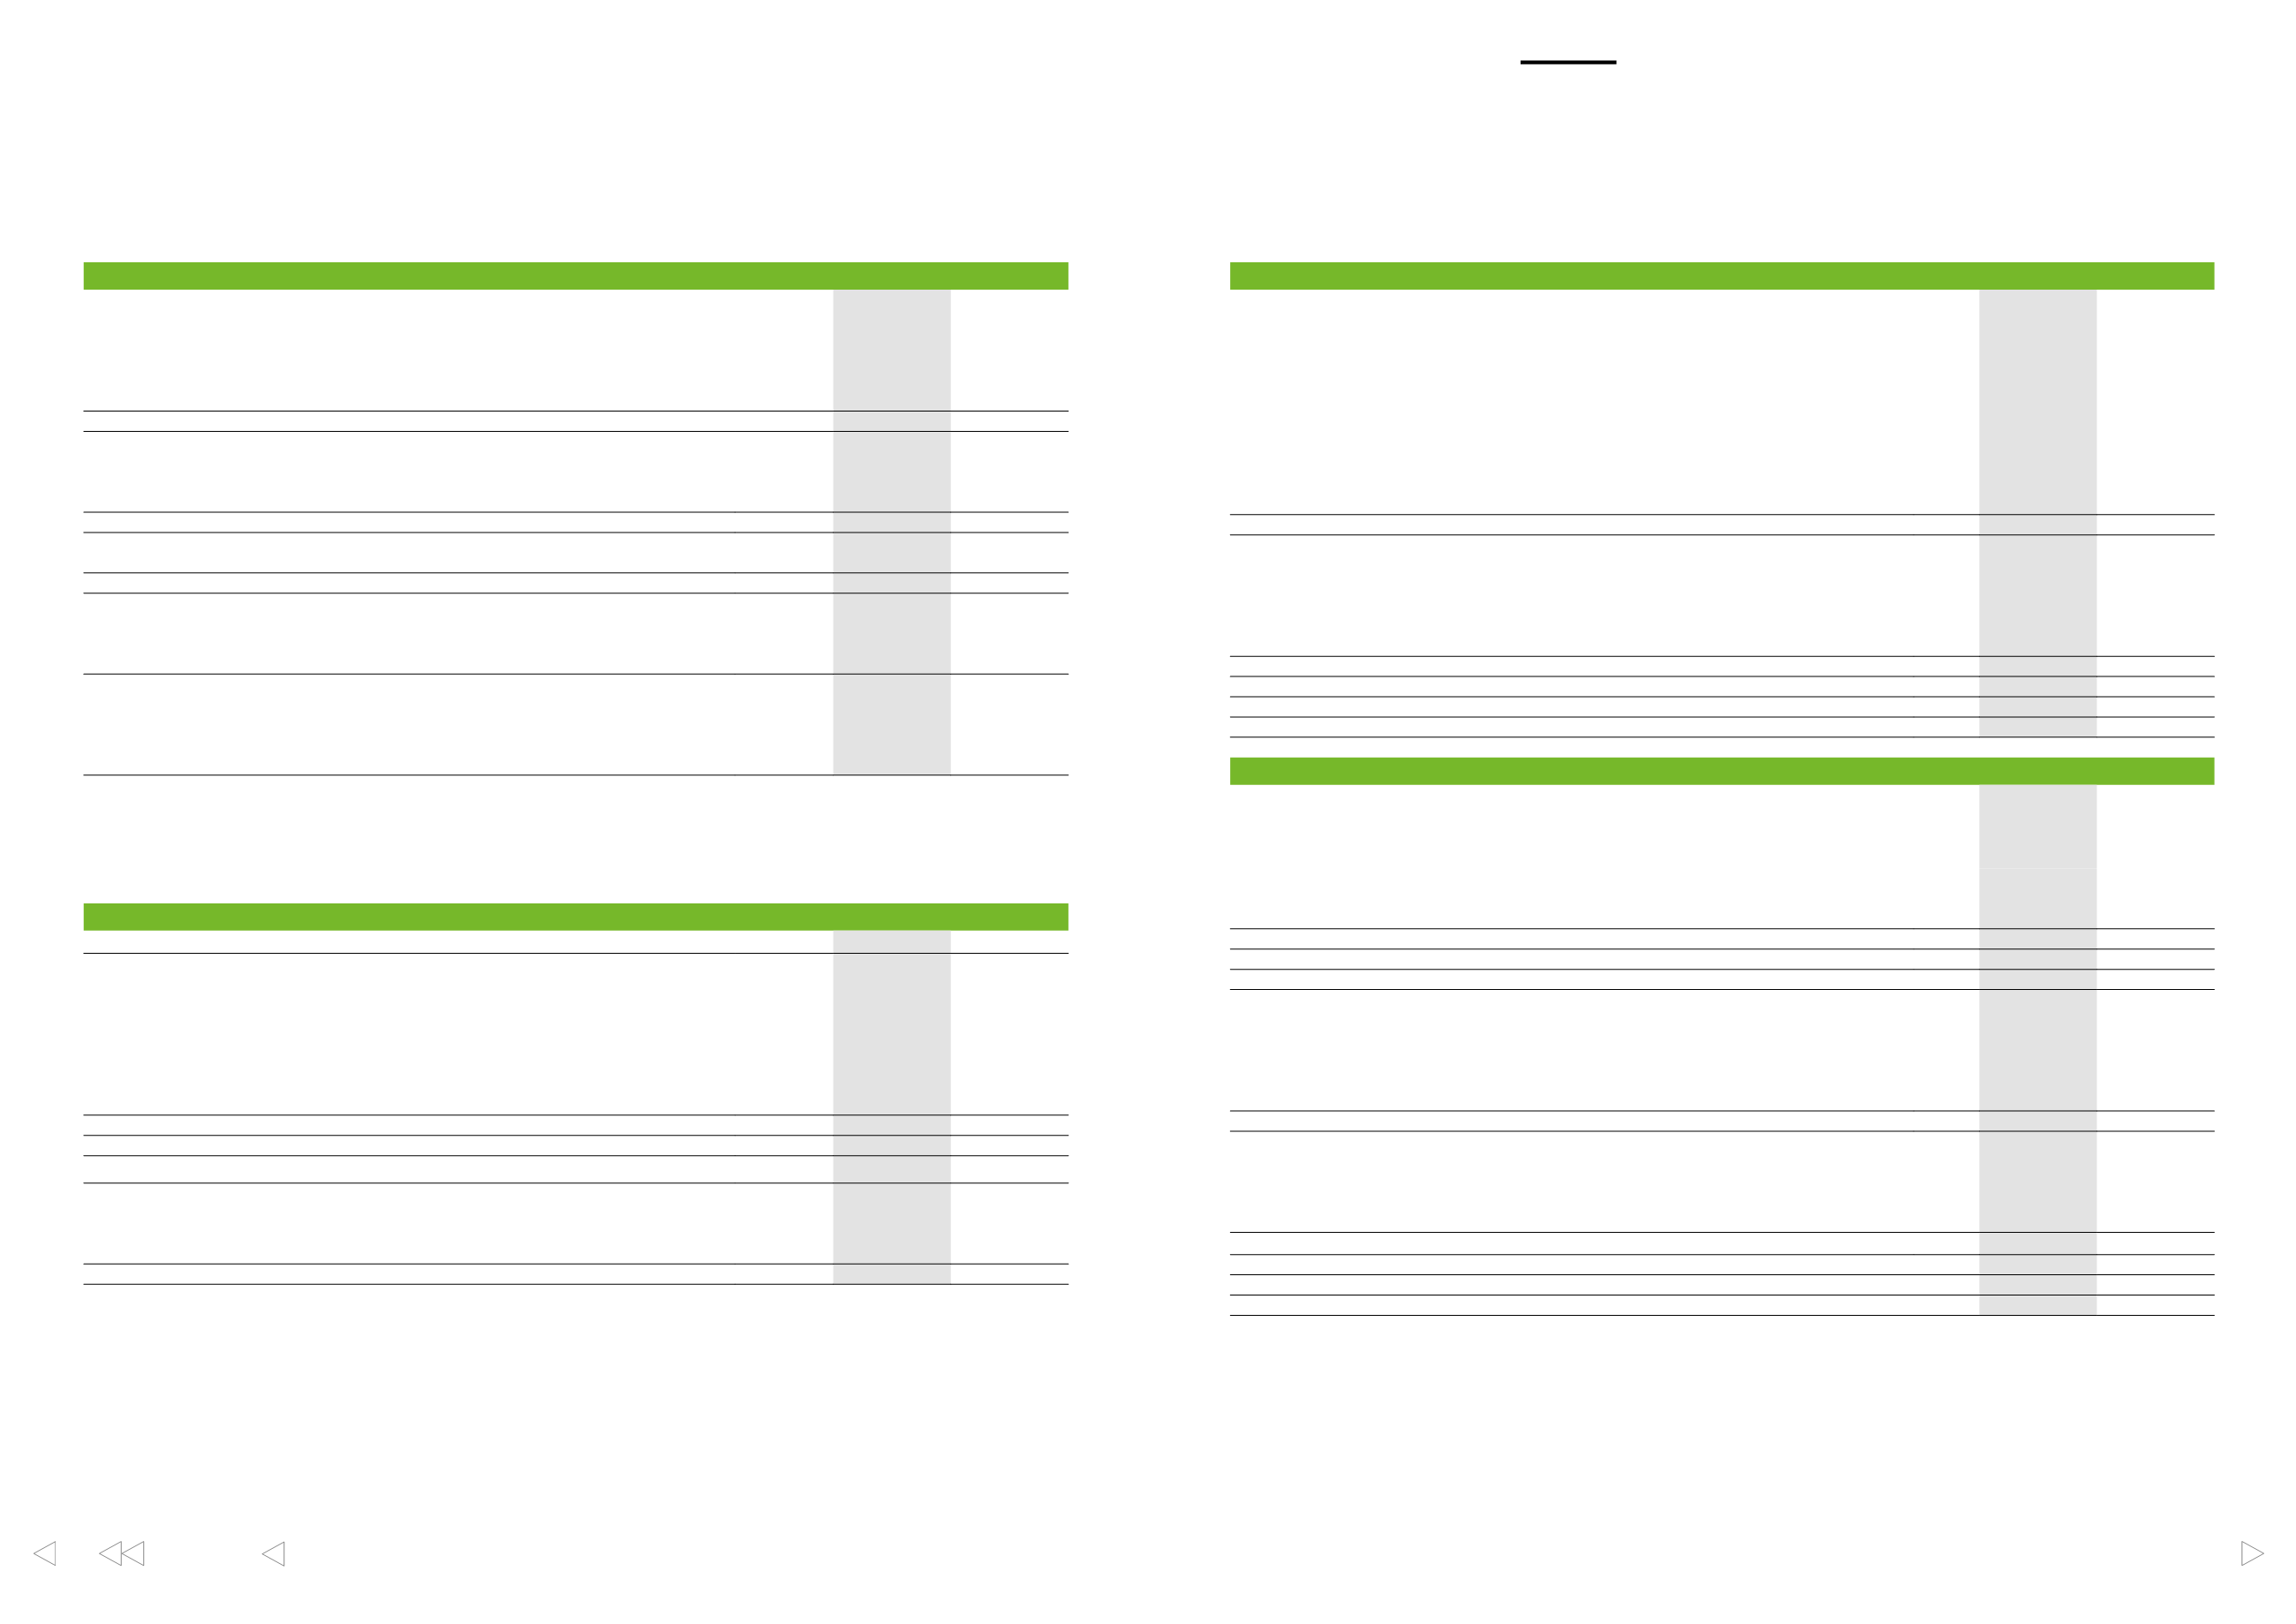
EURm
NOTE
2016
2015
Profit for the period
880
916
Other comprehensive income for the period, net of tax
Items that will not be reclassified to the income statement:
Actuarial gains and losses on defined benefit plans
–97
113
Items that may be reclassified to the income statement:
Translation differences
–14
221
Net investment hedge
–1
–28
Cash flow hedges
73
24
Gains and losses on energy shareholdings
–144
–405
–87
–188
Other comprehensive income for the period, net of tax
7.2
–184
–75
Total comprehensive income for the period
696
841
Attributable to:
Owners of the parent company
695
841
Non-controlling interests
1
–
696
841
EURm
NOTE
2016
2015
Sales
2.1, 2.2
9,812
10,138
Other operating income
2.3
140
13
Costs and expenses
2.3
–8,365
–8,840
Change in fair value of forest assets and wood harvested
4.2
88
352
Share of results of associates and joint ventures
5
3
Depreciation, amortisation and impairment charges
2.3, 4.1, 4.4
–545
–524
Operating profit
1,135
1,142
Gains on sale of energy shareholdings, net
4.3
1
–
Exchange rate and fair value gains and losses
5.4
–7
1
Interest and other finance costs
5.4
–49
–68
Profit before tax
1,080
1,075
Income taxes
7.1
–200
–159
Profit for the period
880
916
Attributable to:
Owners of the parent company
879
916
Non-controlling interests
1
–
880
916
Earnings per share for profit attributable to owners of the parent company
Basic earnings per share, EUR
2.4
1.65
1.72
Diluted earnings per share, EUR
2.4
1.65
1.72
EURm
NOTE
2016
2015
ASSETS
Goodwill
4.4
245
241
Other intangible assets
4.4
301
329
Property, plant and equipment
4.1
4,657
4,895
Forest assets
4.2
1,734
1,738
Energy shareholdings
4.3
1,932
2,085
Other non-current financial assets
5.3
255
332
Deferred tax assets
7.2
446
466
Net retirement benefit assets
3.4
71
93
Investments in associates and joint ventures
29
28
Other non-current assets
47
52
Non-current assets
9,715
10,259
Inventories
4.6
1,346
1,376
Trade and other receivables
4.6, 5.3
1,726
1,743
Other current financial assets
5.3
109
133
Income tax receivables
14
56
Cash and cash equivalents
5.1
992
626
Current assets
4,187
3,934
Assets classified as held for sale
8
–
Assets
13,911
14,193
EURm
NOTE
2016
2015
EQUITY AND LIABILITIES
Share capital
5.5
890
890
Treasury shares
–2
–2
Translation reserve
433
449
Other reserves
5.5
1,416
1,486
Reserve for invested non-restricted equity
5.5
1,273
1,273
Retained earnings
4,225
3,846
Equity attributable to owners of the parent company
8,234
7,942
Non-controlling interests
3
2
Equity
8,237
7,944
Deferred tax liabilities
7.2
457
456
Net retirement benefit liabilities
3.4
817
747
Provisions
4.5
145
154
Non-current debt
5.2, 5.3
1,835
2,797
Other non-current financial liabilities
5.3
110
174
Non-current liabilities
3,364
4,328
Current debt
5.2, 5.3
584
269
Trade and other payables
4.6, 5.3
1,594
1,463
Other current financial liabilities
5.3
116
156
Income tax payables
16
33
Current liabilities
2,309
1,921
Liabilities
5,673
6,249
Equity and liabilities
13,911
14,193
The notes are integral part of these consolidated financial statements
The notes are integral part of these consolidated financial statements
Consolidated financial statements, IFRS
Consolidated income statement
Consolidated statement of comprehensive income
Consolidated balance sheet


