


 10 / 168

2015 Best
Practices Study
Agencies
with
Revenues
Under
$1,250,000
10
Analysis of Agencies with Revenues Under $1,250,000
Key Benchmarks
Profile
Revenues
Expenses
Profitability
Employee Overview
Producer Info
Service Staff Info
Technology
Insurance Carriers
Appendix
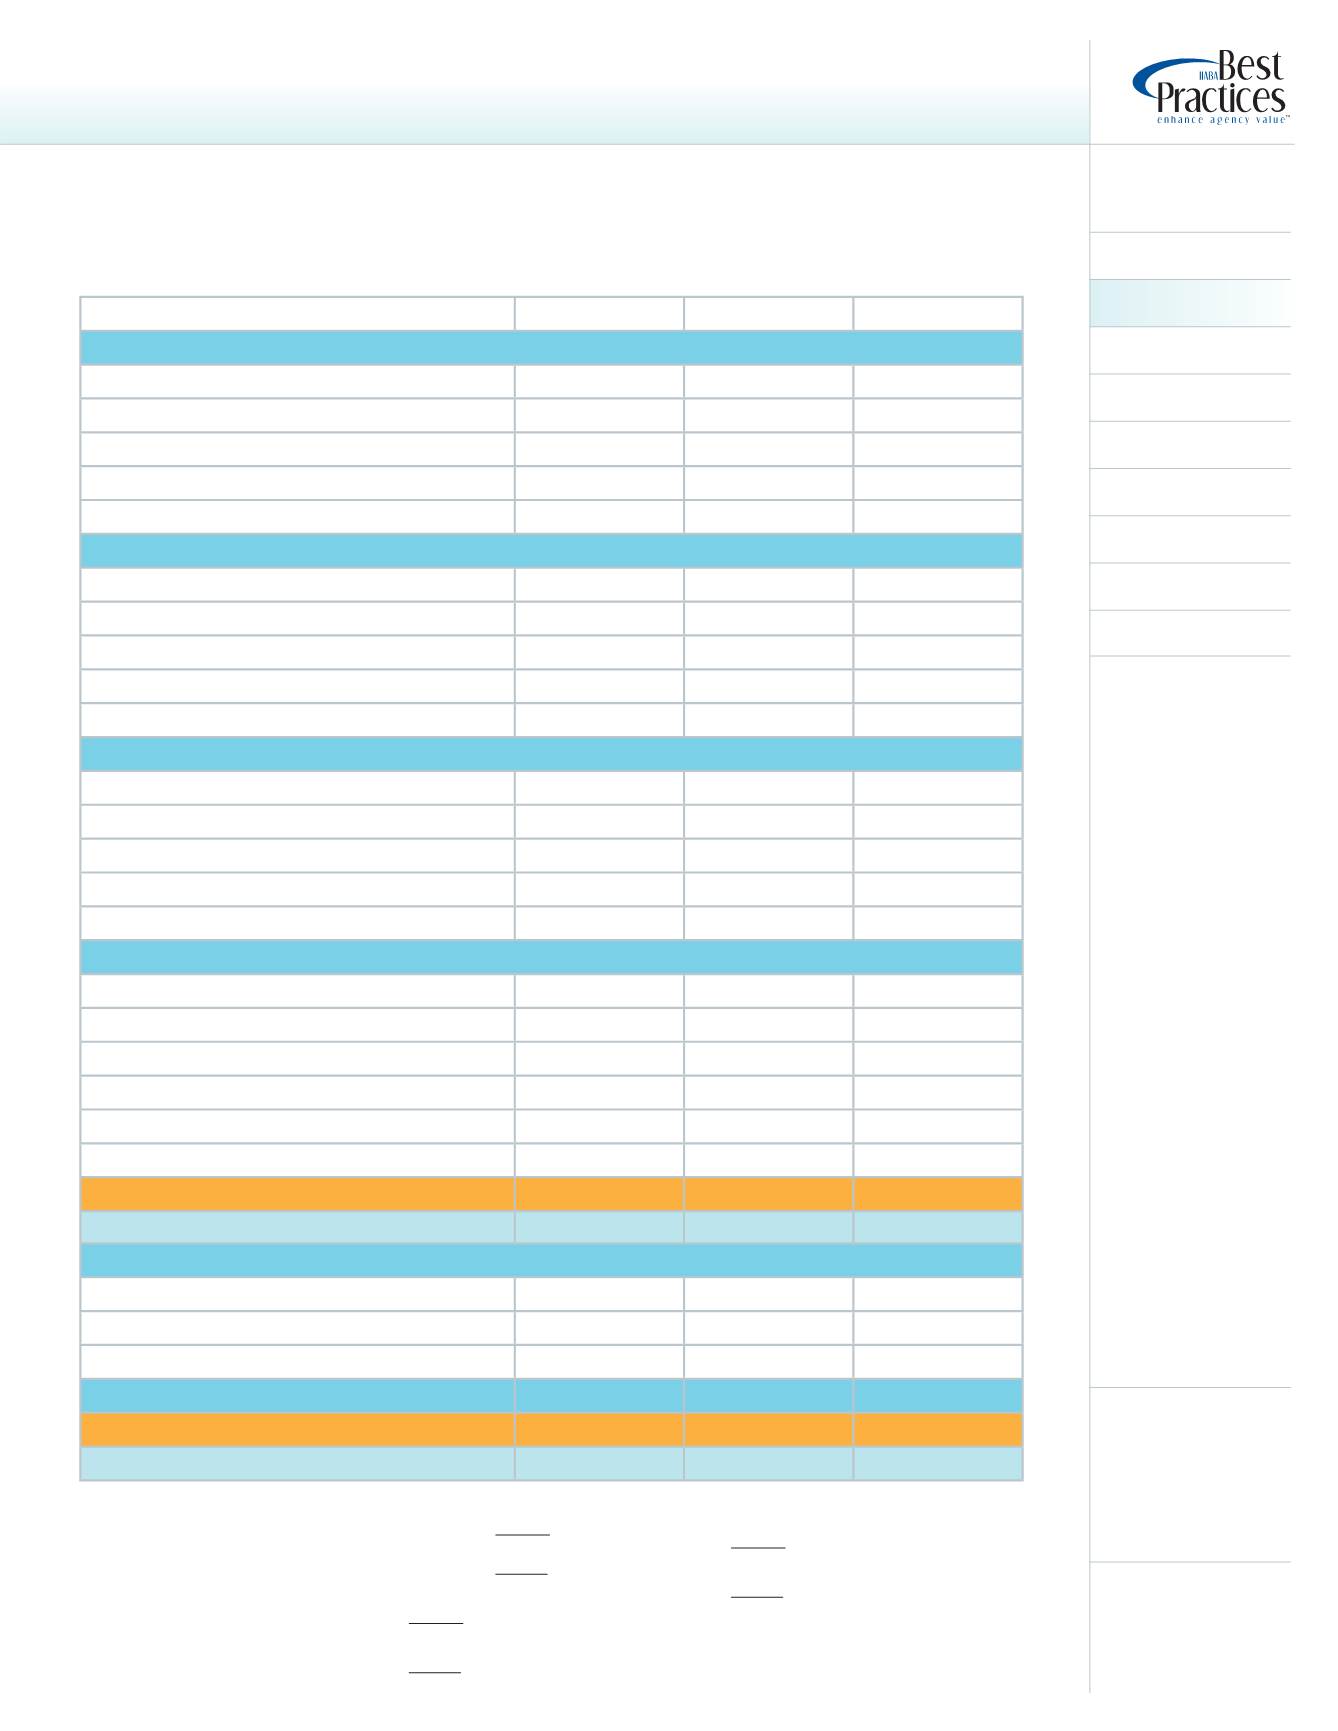
Note: See page 163 for an explanation of column headings
Revenue Growth by Source
(continued)
*Insufficient Data
Average
Top 25% Profit
Top 25% Growth
Group Medical L&H
Renewal Revenues
1
89.8%
62.7%
104.3%
New Business
2
9.4%
29.1%
2.8%
Acquired Revenues
3
0.0%
0.0%
0.0%
Organic Growth
4
-0.8%
-8.2%
7.1%
Total Growth
5
-0.8%
-8.2%
7.1%
All Other Group L&H
Renewal Revenues
1
102.5%
*
*
New Business
2
28.5%
*
*
Acquired Revenues
3
0.0%
*
*
Organic Growth
4
31.0%
*
*
Total Growth
5
31.0%
*
*
Individual L&H
Renewal Revenues
1
51.9%
51.5%
*
New Business
2
44.6%
42.7%
*
Acquired Revenues
3
0.0%
0.0%
*
Organic Growth
4
-3.5%
-5.8%
*
Total Growth
5
-3.5%
-5.8%
*
Total Commissions & Fees (P&C, L&H)
Renewal Revenues
1
92.7%
94.4%
102.7%
New Business
2
13.0%
12.5%
13.1%
Acquired Revenues
3
0.0%
0.0%
0.0%
Organic Growth
4
5.7%
6.9%
15.8%
Total Growth
5
5.7%
6.9%
15.8%
Brokerage Commission Expense Growth
*
*
*
Net Commissions & Fees Growth (Organic)
6
5.8%
6.9%
15.8%
Net Commissions & Fees Growth (Total)
7
5.8%
6.9%
15.8%
Other Income
P&C Contingent Income Growth
-10.5%
-21.5%
-7.7%
L&H Bonus Income Growth
*
*
*
Investment Income Growth
-7.2%
*
*
GROSS REVENUE GROWTH
5.0%
4.4%
16.2%
NET REVENUE GROWTH (ORGANIC)
8
5.0%
4.4%
16.2%
NET REVENUE GROWTH (TOTAL)
9
5.0%
4.4%
16.2%
1 Renewal Revenues
are presented as a % of prior year’s
total revenues for this line of business. This figure is
impacted by attrition (loss or retention of accounts)
and by changes in premium and commission levels.
The higher the %, the more favorable the results.
2 New Business
is presented as a % of prior year’s
total revenues for this line of business. The higher
the %, the more favorable the results.
3 Acquired Revenues
are presented as a % of prior
year’s total revenues for this line of business. The %
indicates the significance of acquired business.
4 Organic Growth
represents growth in revenues
from prior year excluding acquired revenues.
5 Total Growth
represents growth in revenues
from prior year including acquired revenues.
6 Growth in Total Commissions & Fees
(
less
Brokerage Commission Expense)
from prior year
excluding acquired revenues.
7 Growth in Total Commissions & Fees
(
less
Brokerage Commission Expense)
from prior year
including acquired revenues.
8 Growth in Net Revenues
(
Gross Revenue less
Brokerage Commission Expense
) from prior year
excluding acquired revenues.
9 Growth in Net Revenues
(
Gross Revenue less
Brokerage Commission Expense
) from prior year
including acquired revenues.