


 93 / 124


South-North Corridor GRIP 2017 |
93
Table 7.5:
Boundary conditions for case study 3a and 3b
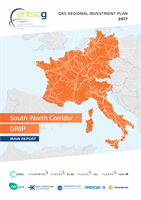
Figure 7.11:
Case study 3a flow patterns
Figure 7.12:
Case study 3b flow patterns
ITs
IT
ITe
CH
DEn
FRn
AT
2030 LOW Disruption Norpipe
NO min
ITs
IT
ITe
CH
DEn
FRn
AT
2030 PCI Disruption Norpipe
NO min
7.3.5 CASE STUDY 3A/3B
CASE DESCRIPTION
Year
2030
Climatic conditions
Peak Demand: Northern EU
Supply disruptions
Norwegian flows (Norpipe to DE)
Infrastructure level
a) Low
b) PCI
Supply prices
Norwegian most expensive
A third interesting case assumes the interruption of Norwegian flows towards Ger-
many at the Emden interconnection point, as it is one of the main access points for
this source to Europe. At the same time, the residual flows from Norway are as-
sumed to become relatively more expensive, since the availability of this supply is
becoming more limited.
The outcomes of this configuration differ from the previous ones due to the wide
availability of Russian flows, neither disrupted nor restricted by price constraints. In
this situation, reverse flows are activated only from Italy towards Switzerland and
Germany, while the IP between Italy and Austria is used to convey part of the
Russian resources towards Europe. Again, in the PCI infrastructure level more gas
is made available to the Italian system (Figure 7.12) and indirectly for the overall of
Europe compared to the “Low” infrastructure level situation (Figure 7.11).