


 92 / 124


92 |
South-North Corridor GRIP 2017
Table 7.4:
Boundary conditions for case study 2c and 2d
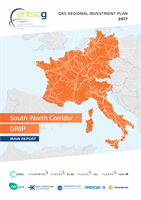
Figure 7.9:
Case study 2c flow patterns
Figure 7.10:
Case study 2d flow patterns
ITs
IT
ITe
CH
DEn
FRn
AT
2020 LOW Disruption Ukraine
NO min
ITs
IT
ITe
CH
DEn
FRn
AT
2030 PCI Disruption Ukraine
NO min
7.3.4 CASE STUDY 2C/2D
CASE DESCRIPTION
Year
c) 2020
d) 2030
Climatic conditions
Peak Demand: Northern EU
Average Winter: Rest of EU
Supply disruptions
Russian flows via UA
Infrastructure level
c) Low
d) PCI
Supply prices
Norwegian most expensive
Capacity
CH>FRn bundled firm
As for section 7.3.2, the exercise to adopt different climatic conditions across Europe
and fully (bundled) firm capacity at Oltingue IP from Switzerland to France has been
repeated with other variables constant except the exploration of the year 2020 in
addition to 2030.
The results obtained in cases c and d generally reflect the trend of a full reverse flow
configuration towards Northern Europe already detected in the analogous cases 1c
and d. A complete reverse flow appears already in 2020 – with all SNC reverse flow
projects commissioned – providing even more relevant results in 2030, with the
commissioning of the other projects in Italy which can maximise the SNC potential.