


 10 / 12

10 |
Ten Year Network Development Plan 2015 Annex C5
0
100
50
150
200
TWh/y
2015
2016
2017
2018
2019
2020
2021
2022
2023
2024
2025
2026
2027
2028
2029
2030
2031
2032
2033
2034
2035
Maximum
Intermediate
Minimum
Maximum TYNDP 2013
Intermediate TYNDP 2013
Minimum TYNDP 2013
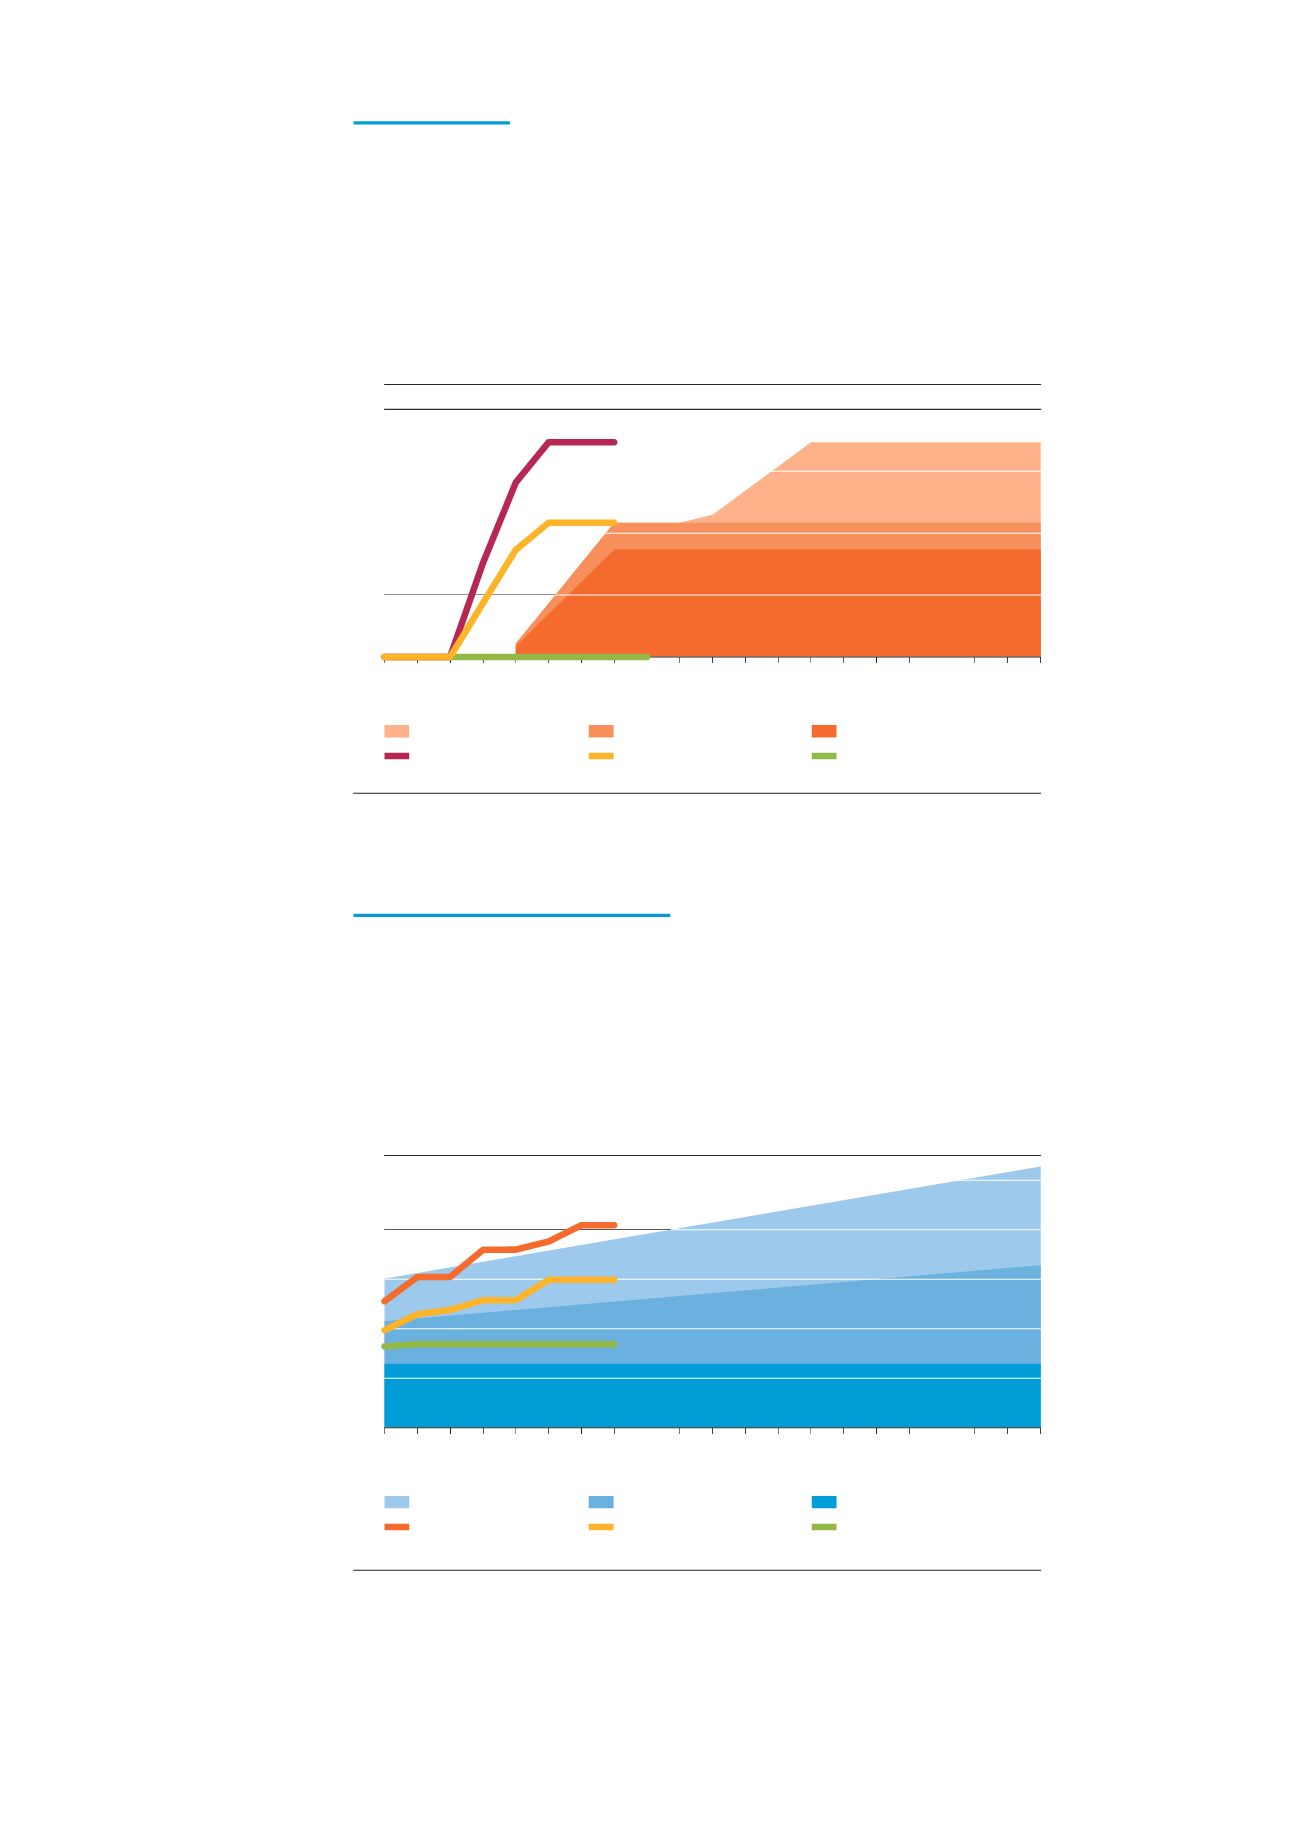
Figure 2.8:
Comparison of supplies from Azerbaijan between TYNDP 2015 and TYNDP 2013
0
1,000
500
1,500
2,500
2,000
TWh/y
2015
2016
2017
2018
2019
2020
2021
2022
2023
2024
2025
2026
2027
2028
2029
2030
2031
2032
2033
2034
2035
Maximum
Intermediate
Minimum
Maximum TYNDP 2013
Intermediate TYNDP 2013
Minimum TYNDP 2013
Figure 2.9:
Comparison of LNG supplies between TYNDP 2015 and TYNDP 2013
2.6 AZERBAIJAN
The major change has been introduced in the minimum scenario as the projects
evolved more in the meantime. Instead of the previous zero flows, a minimum flow
of 80% based on the intermediate scenario has been introduced now. Hence, the
projected minimum supply from Azerbaijan is now constantly 87TWh/y. Additional
changes have been made in the assumption of first gas supplies (change from 2018
to 2019) based on more recent data.
2.7 LIQUEFIED NATURAL GAS
LNG projections in TYNDP 2013 and this report are very similar. In TYNDP 2013 the
assumptions underlying the projections were based on aggregated load factors for
European send-out capacities of LNG terminals. In this report, projections are based
on the supply potentials of the different production areas with assumptions on the
proportion delivered to Europe.