


 5 / 12

Ten Year Network Development Plan 2015 Annex C5 |
5
0
5,000
2,500
7,500
10,000
GWh/d
Peak day Vision 3
Peak day TYNDP 2013
Peak day Vision 1
2015
2016
2017
2018
2019
2020
2021
2022
2025
2030
2035
Figure 1.5:
Comparison of peak day gas demand for power generation between TYNDP 2015 and TYNDP 2013
0
21,000
14,000
7,000
28,000
35,000
GWh/d
Total peak green
Total peak TYNDP 2013
Total peak grey
2015
2016
2017
2018
2019
2020
2021
2022
2025
2030
2035
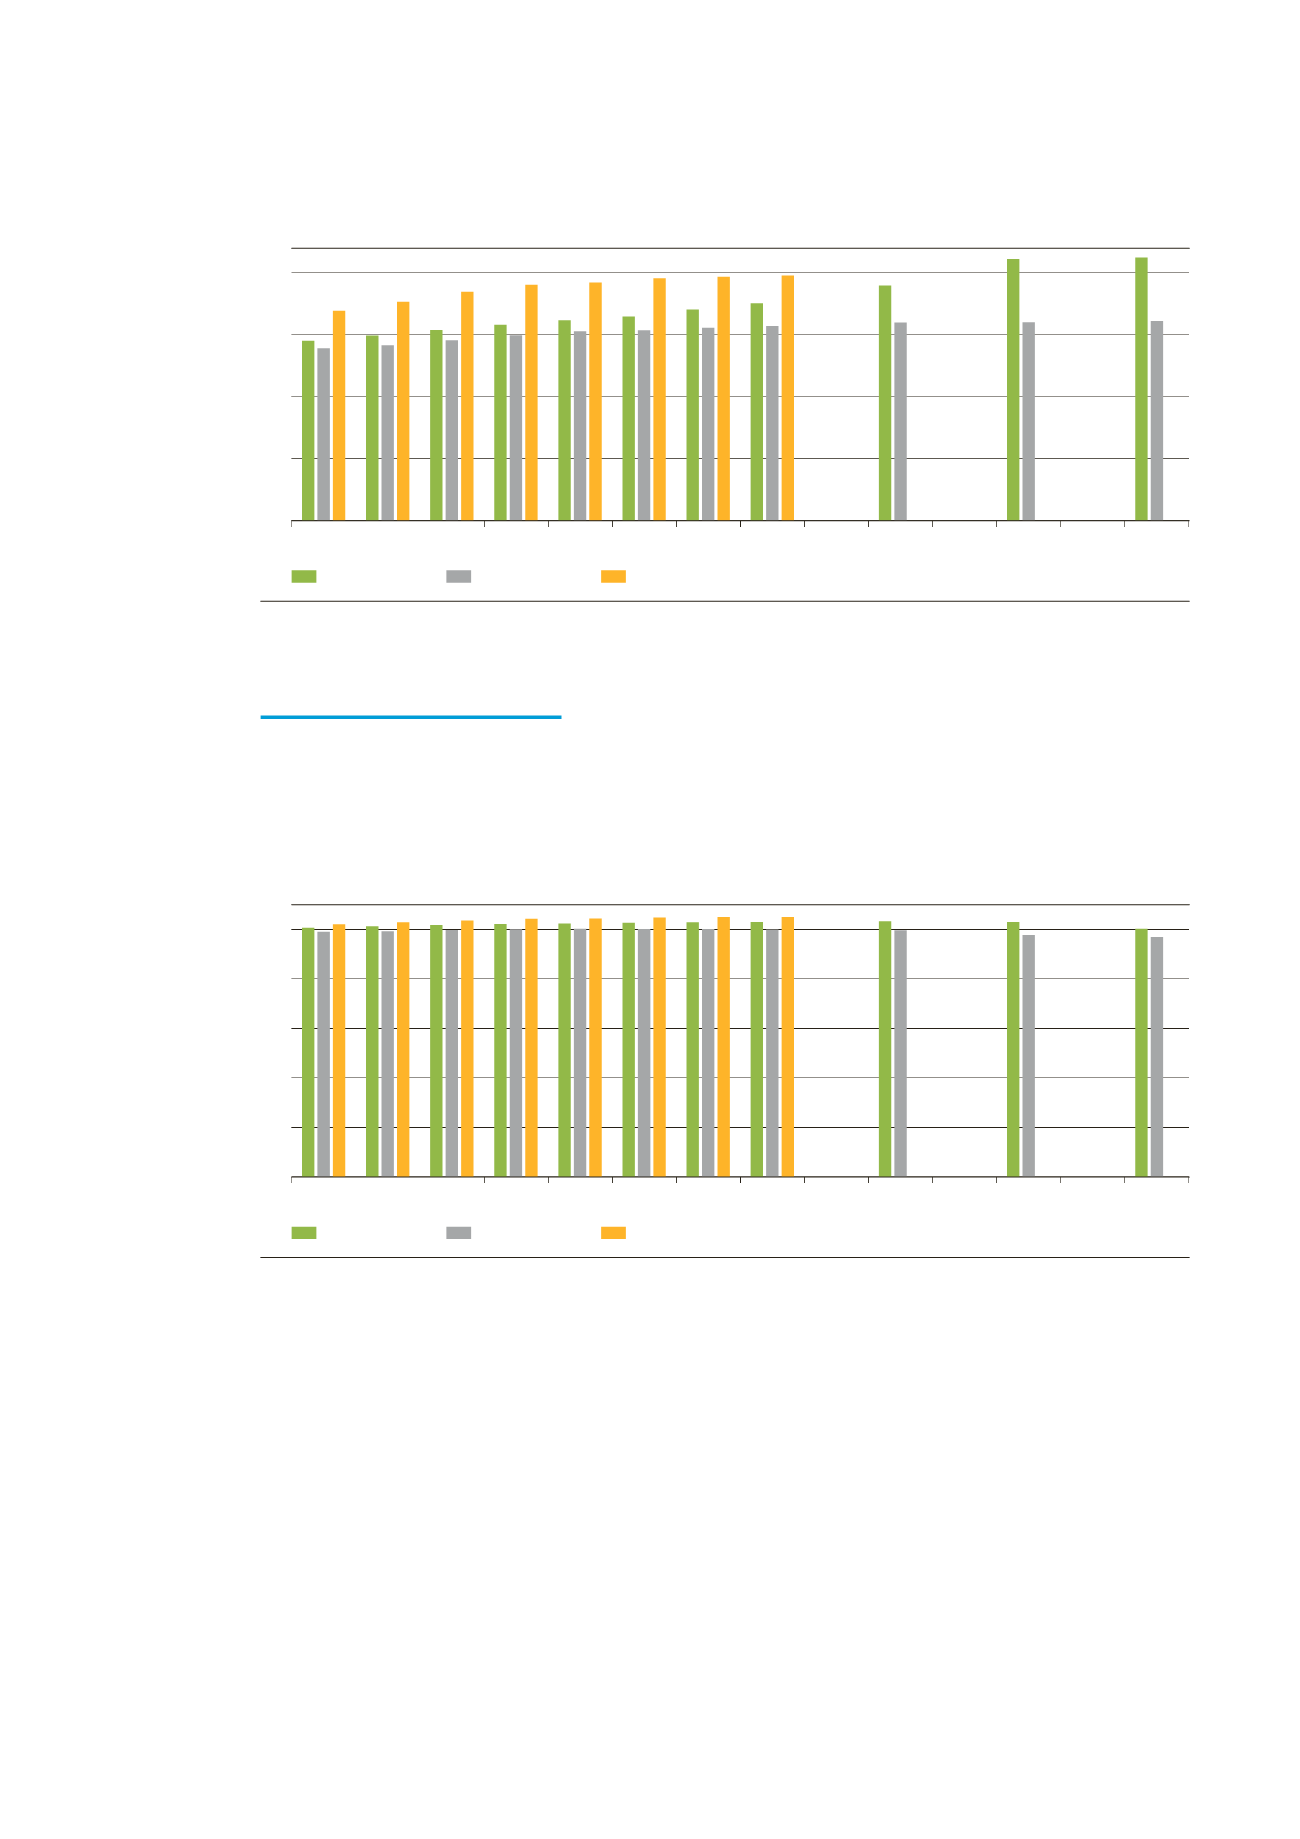
Figure 1.6:
Comparison of total peak day gas demand between TYNDP 2015 and TYNDP 2013
1.2.3 Total peak day gas demand
The TYNDP 2015 projections show slightly lower levels for the total peak day gas
demand. The higher levels of final peak gas demand do not fully compensate the
lower levels of peak day gas demand for power generation.