


 6 / 12

6 |
Ten Year Network Development Plan 2015 Annex C5
0
400
800
1,200
1,600
TWh/y
2015
2016
2017
1018
2019
2020
2021
2022
2023
2024
2025
2026
2027
2028
2029
2030
2031
2032
2033
2034
2035
Conventional production (existing+FID)
Conventional production (Non-FID)
TYNDP 2013
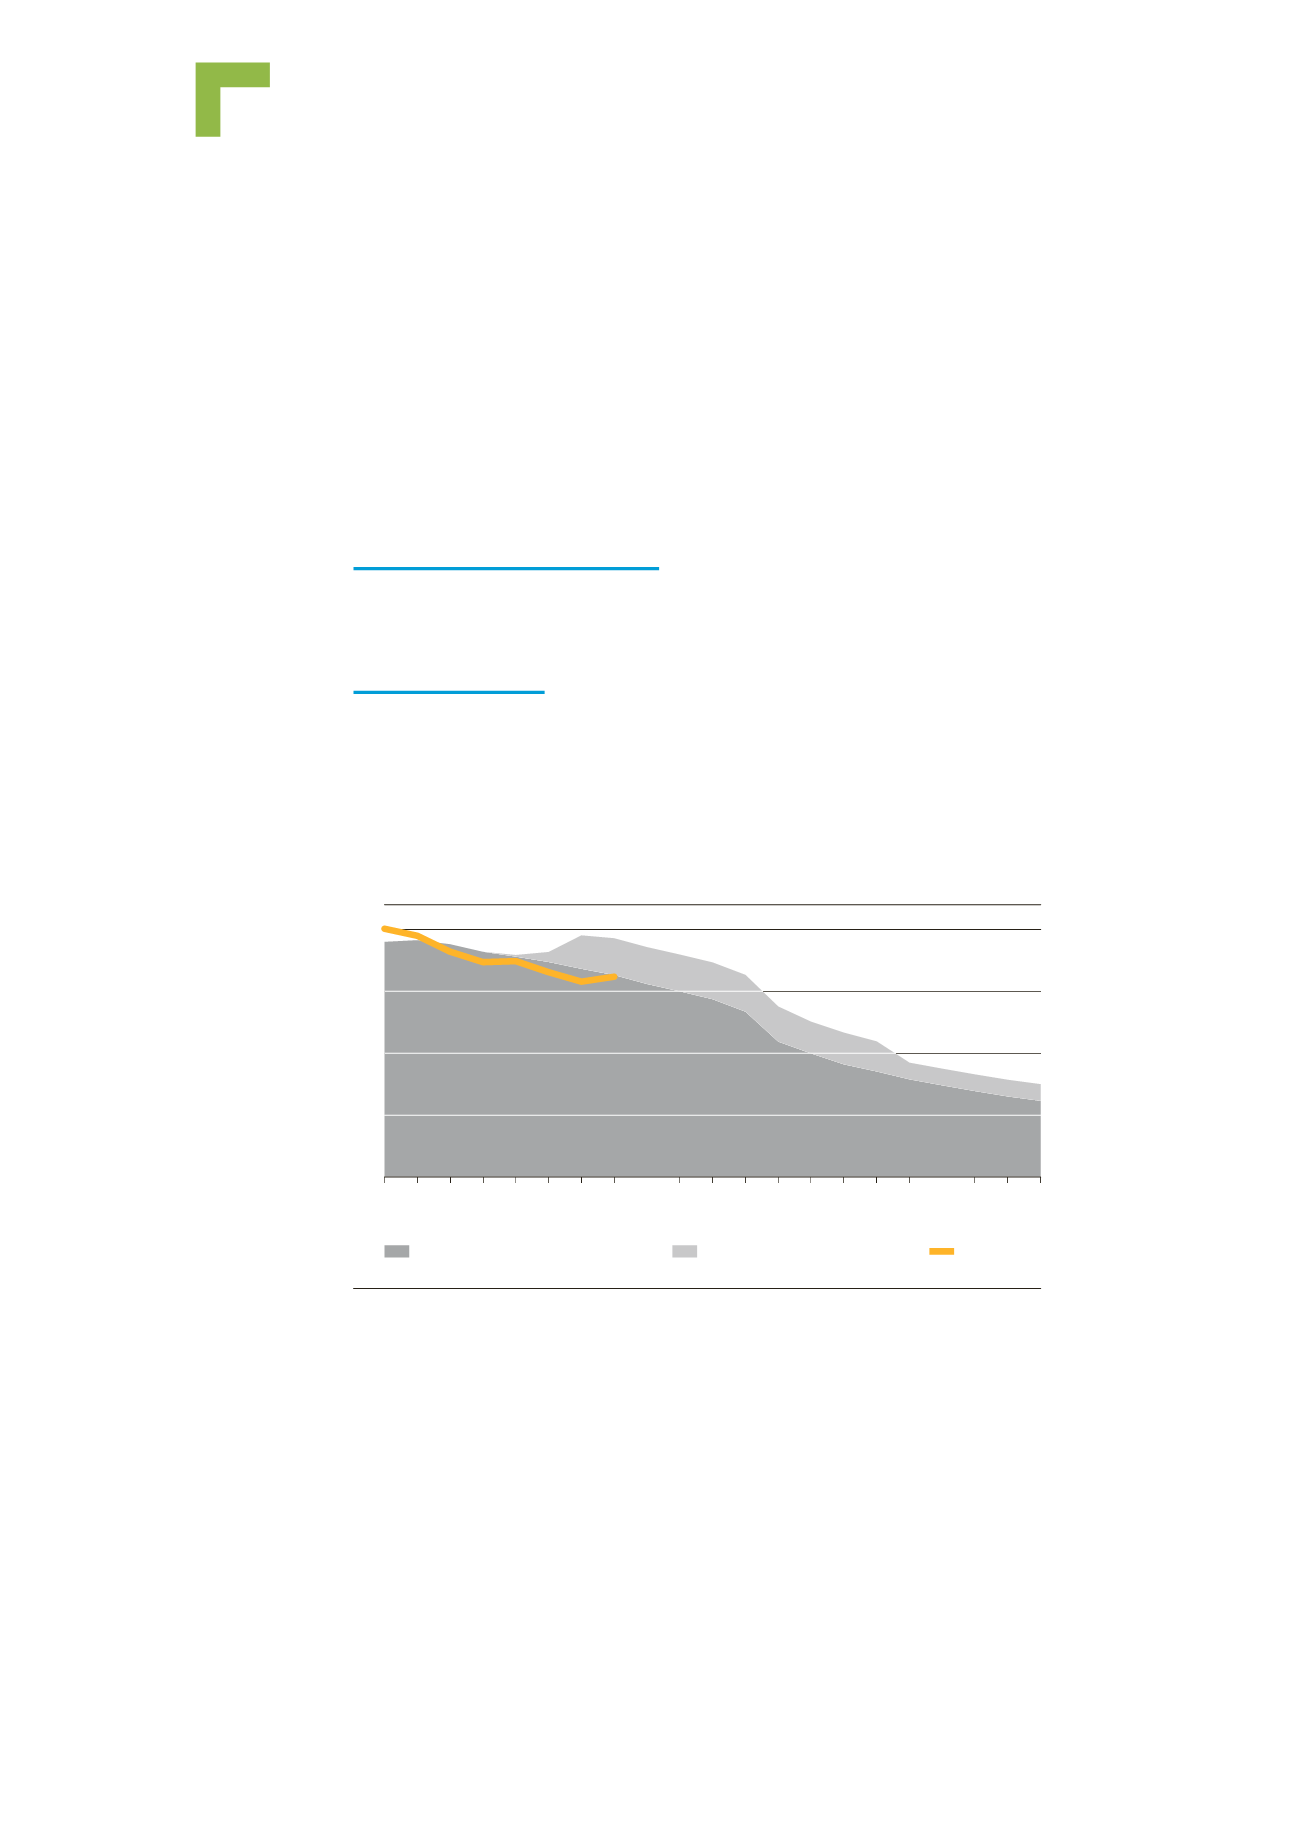
Figure 2.1:
Comparison of conventional production between TYNDP 2015 and TYNDP 2013
2 Evolution of difference in
the supply scenarios
ENTSOG stays basically with the already elaborated
fundamentals for the supply scenarios and refreshed
them with reasonable information. At the same time,
the increase of the time horizon has led to more
uncertainty in the later period of each scenario.
2.1 NATIONAL PRODUCTION
2.1.1 Conventional gas
The supply from conventional production based on TSO projections, shows a similar
downward trend as identified in TYNDP 2013. Non-FID projects for new convention-
al production could lead to a rise in 2019 but would not stop the overall decline in
European conventional production over the following decades.