


 3 / 12

Ten Year Network Development Plan 2015 Annex C5 |
3
0
1,500
1,000
500
2,000
2,500
TWh/y
Vision 1 min
Vision 1 max
Vision 3 min
Vision 3 max
TYNDP 2013
2015
2016
2017
2018
2019
2020
2021
2022
2025
2030
2035
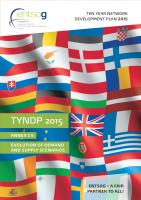
Figure 1.2:
Comparison of annual gas demand for power generation between TYNDP 2015 and TYNDP 2013
4,000
5,500
5,000
4,500
6,000
TWh/y
GREY – Scenario B – Vision 1
Demand range under TSOs scenarios (final+power)
Total gas demand TYNDP 2013
GREEN – Scenario A – Vision 3
2015
2016
2017
2018
2019
2020
2021
2022
2023
2024
2025
2026
2027
2028
2029
2030
2031
2032
2033
2034
2035
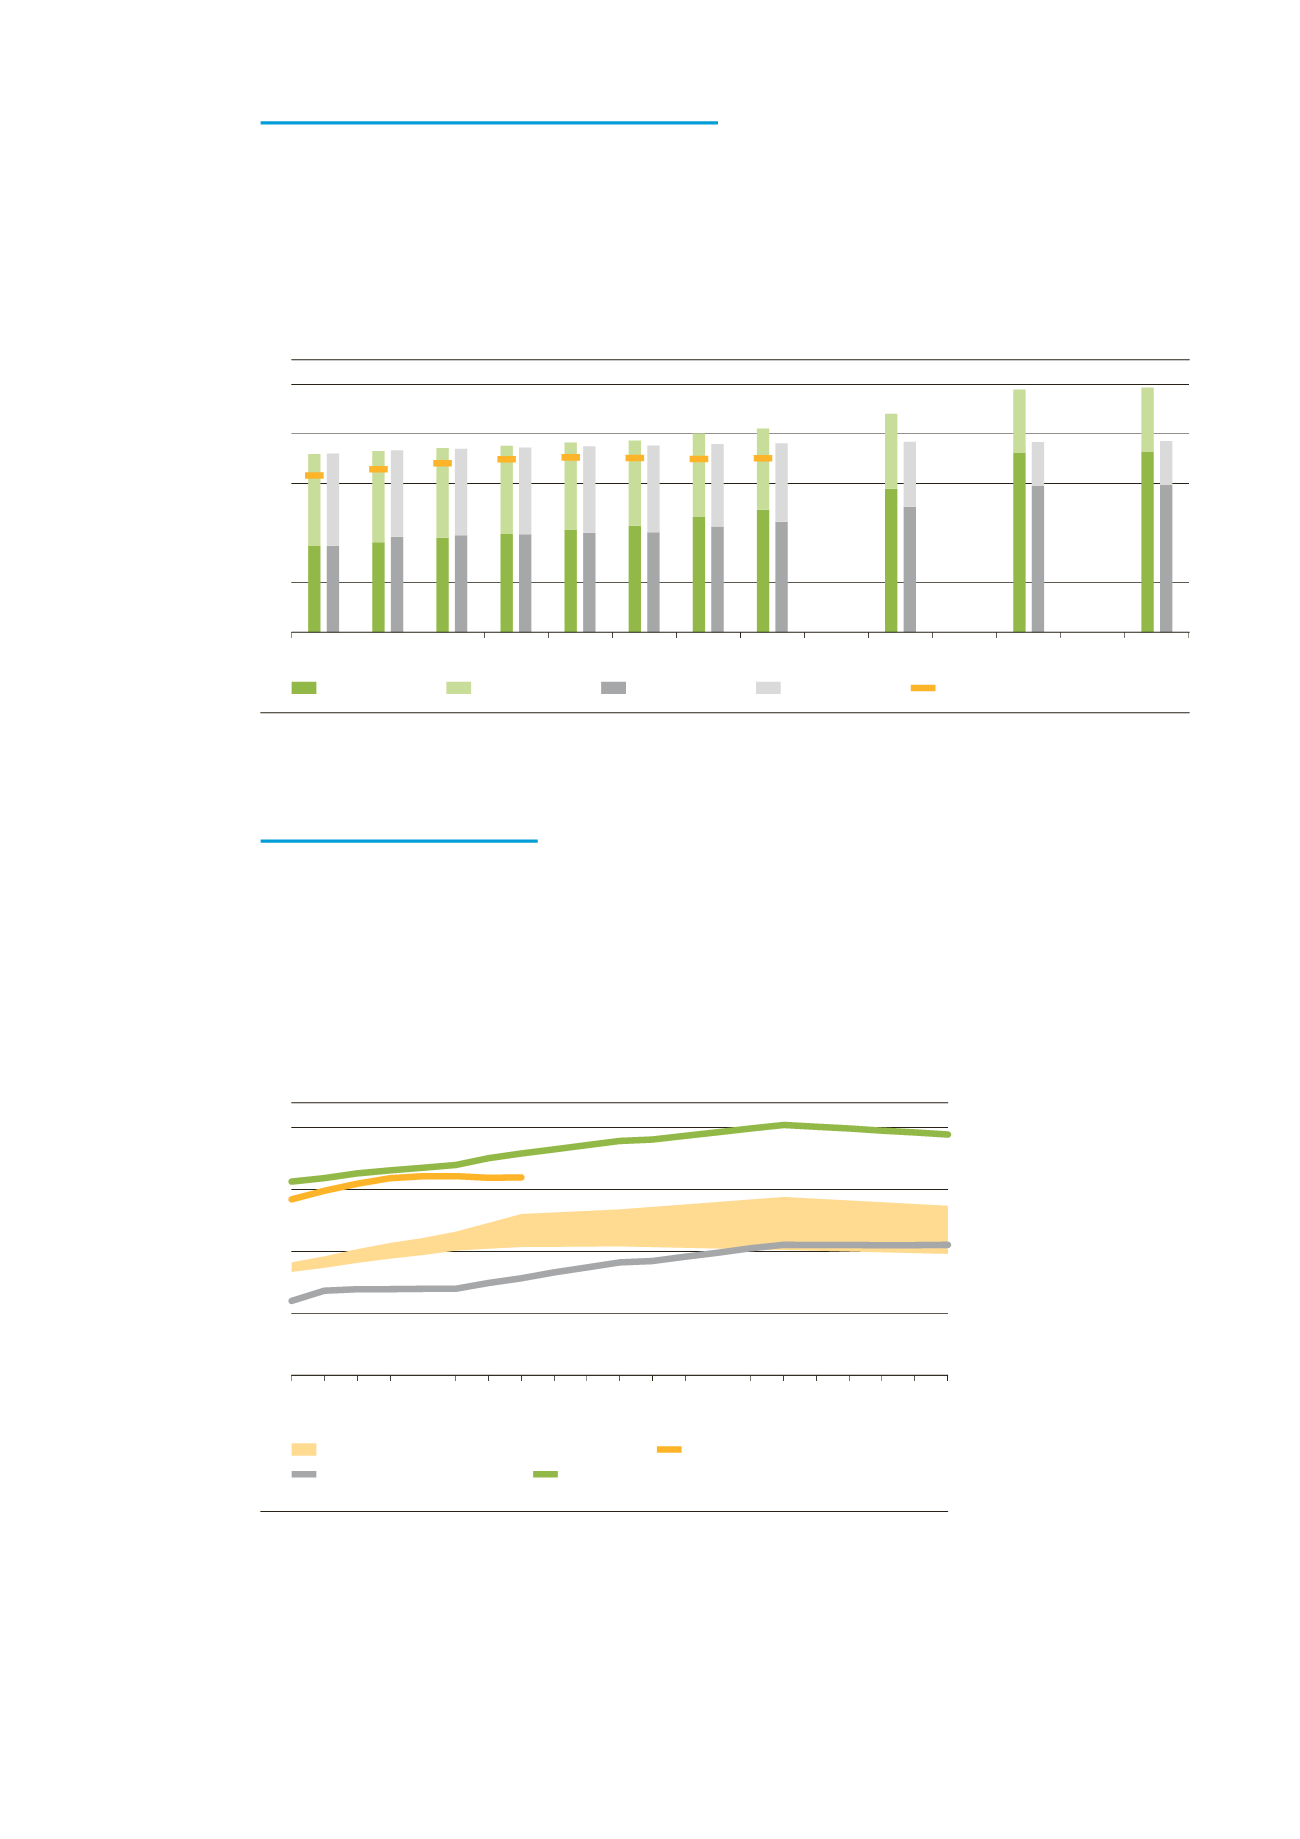
Figure 1.3:
Comparison of total annual gas demand between TYNDP 2015 and TYNDP 2013
1.1.2 Annual gas demand for power generation
Based on the feedback received after the publication of the TYNDP 2013, ENTSOG
has developed an enhanced approach for the assessment of power generation.
Instead of analyzing a single projection, a range of scenarios based on ENTSO-E
data is now assessed taking into account uncertainties within this sector. Power gen-
eration projection from TYNDP 2013 is in the upper part of the TYNDP 2015 range.
1.1.3 Total annual gas demand
The following figure shows the range of annual total gas demand for TYNDP 2015.
TYNDP 2013 total demand level is close to the upper level of TYNDP 2015. The
difference varies between -1% and -3%. A range has also been created using TSOs
submissions for final gas demand including projections for power generation. These
latest projections are based on information provided by the TSOs or the average of
data from Vision 1 and Vision 3 where TSOs data was not available.