


 7 / 12

Ten Year Network Development Plan 2015 Annex C5 |
7
0
150
300
450
600
TWh/y
2015
2016
2017
1018
2019
2020
2021
2022
2023
2024
2025
2026
2027
2028
2029
2030
2031
2032
2033
2034
2035
Maximum
Intermediate
Minimum (zero)
TYNDP 2013
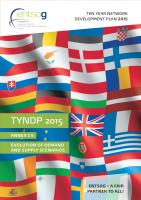
Figure 2.3:
Comparison of shale gas production between TYNDP 2015 and TYNDP 2013
0
50
100
150
200
TWh/y
2015
2016
2017
1018
2019
2020
2021
2022
2023
2024
2025
2026
2027
2028
2029
2030
2031
2032
2033
2034
2035
Maximum
Intermediate
Minimum
TYNDP 2013
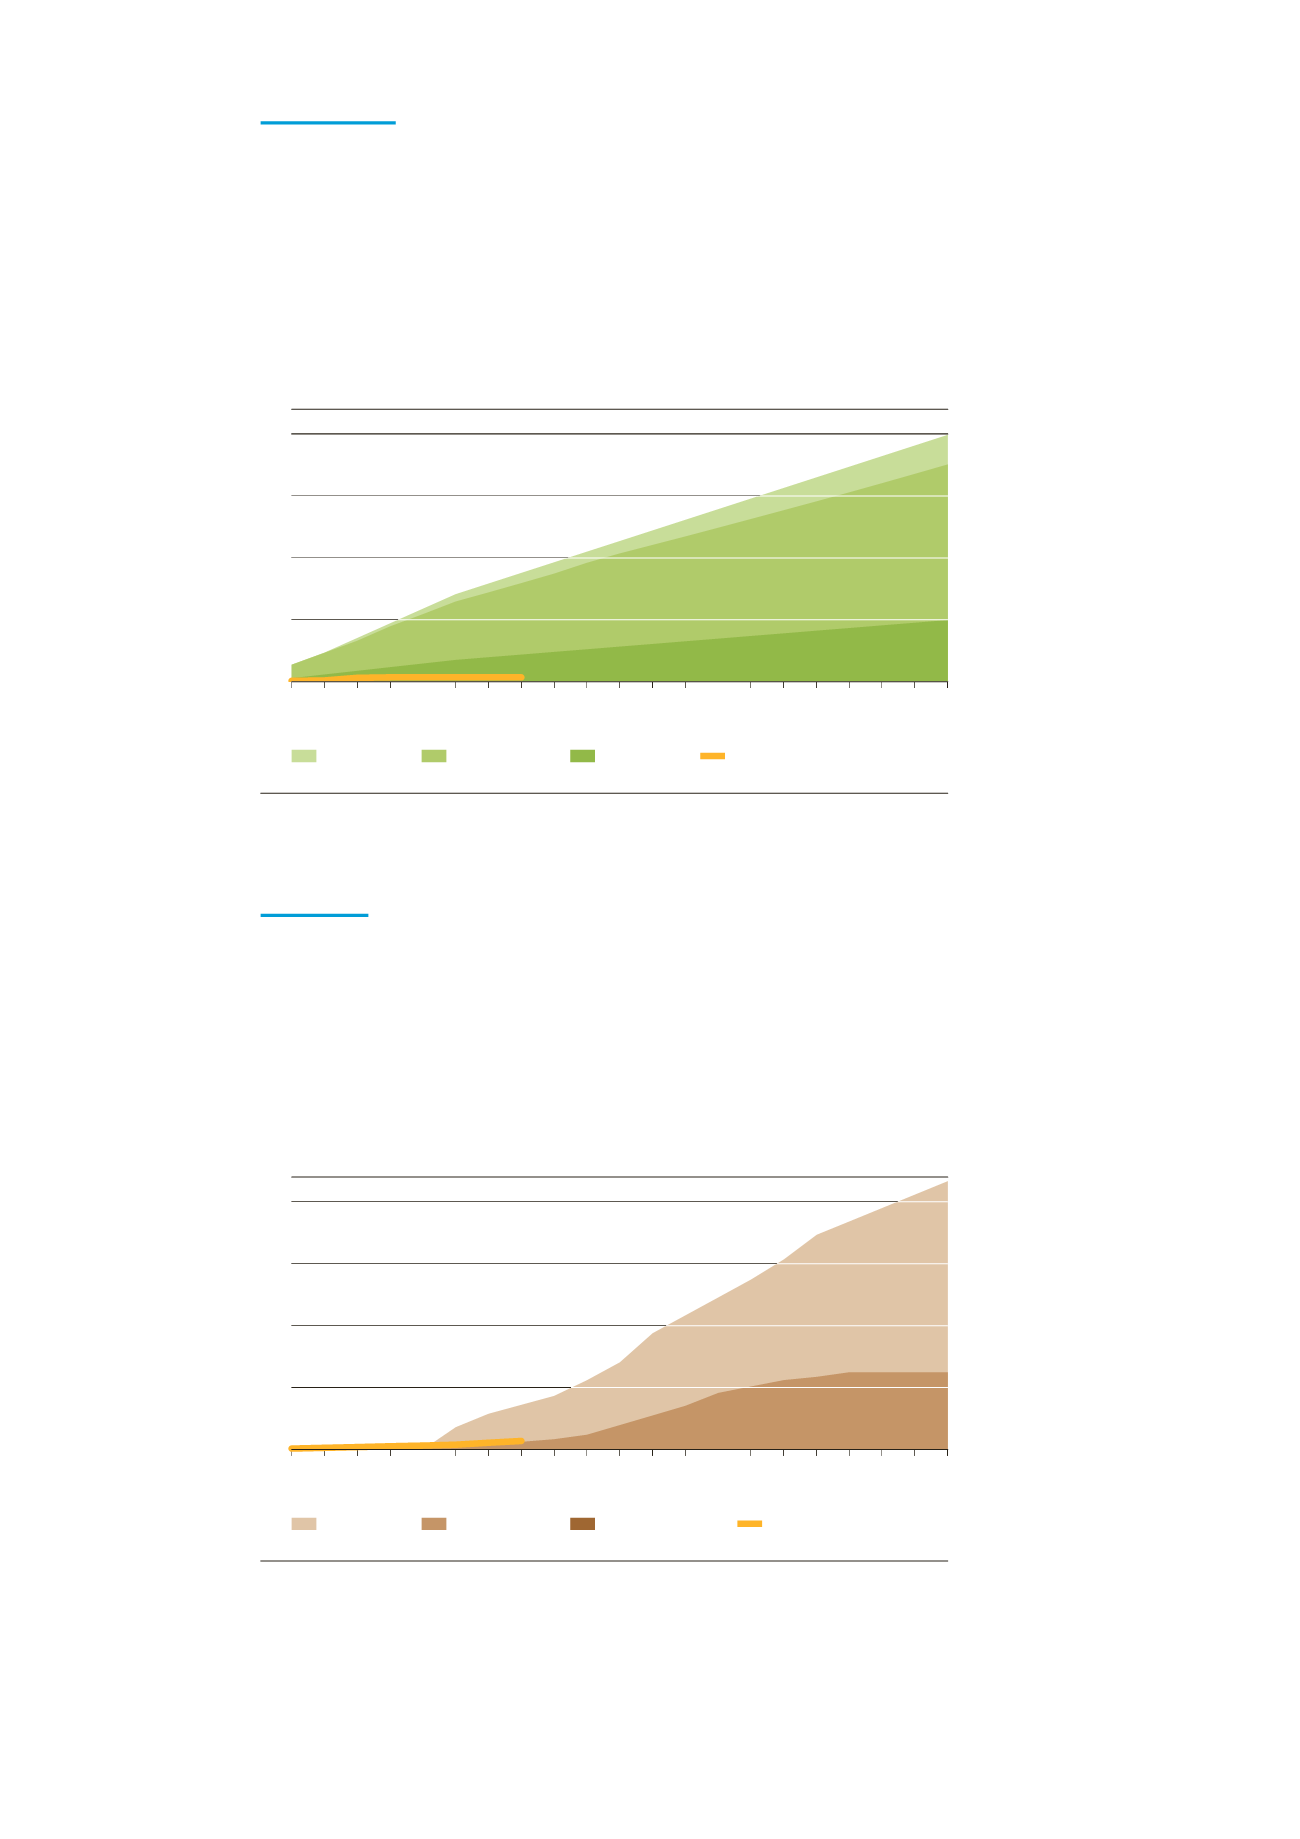
Figure 2.2:
Comparison of biomethane production between TYNDP 2015 and TYNDP 2013
2.1.2 Biomethane
Whereas only two TSOs reported biomethane figures in the previous edition, this
time nine TSOs gave information on projections and ENTSOG has identified other
data sources. This has allowed ENTSOG to generate the three supply scenarios
whereas only a single supply scenario was generated for the previous TYNDP. The
increased information has led to a much higher estimation of biomethane in the
grids. The intermediate scenario is based on TSO projections whereas the maximum
and minimum scenarios are based on other literature sources.
2.1.3 Shale gas
More available information, in comparison to the previous TYNDP, has allowed
ENTSOG to generate the three general supply scenarios. This has resulted in a bet-
ter vision of potential shale gas supplies compared to the limited projection in the
previous edition. The intermediate supply scenario is based on TSOs data whereas
the maximum supply scenario is based on literature. The minimum supply forecast
is zero to reflect the current uncertainty as described in the Supply Chapter.