


 257 / 260

Police Operations and Data Analysis Report, Morgan Hill, California
119
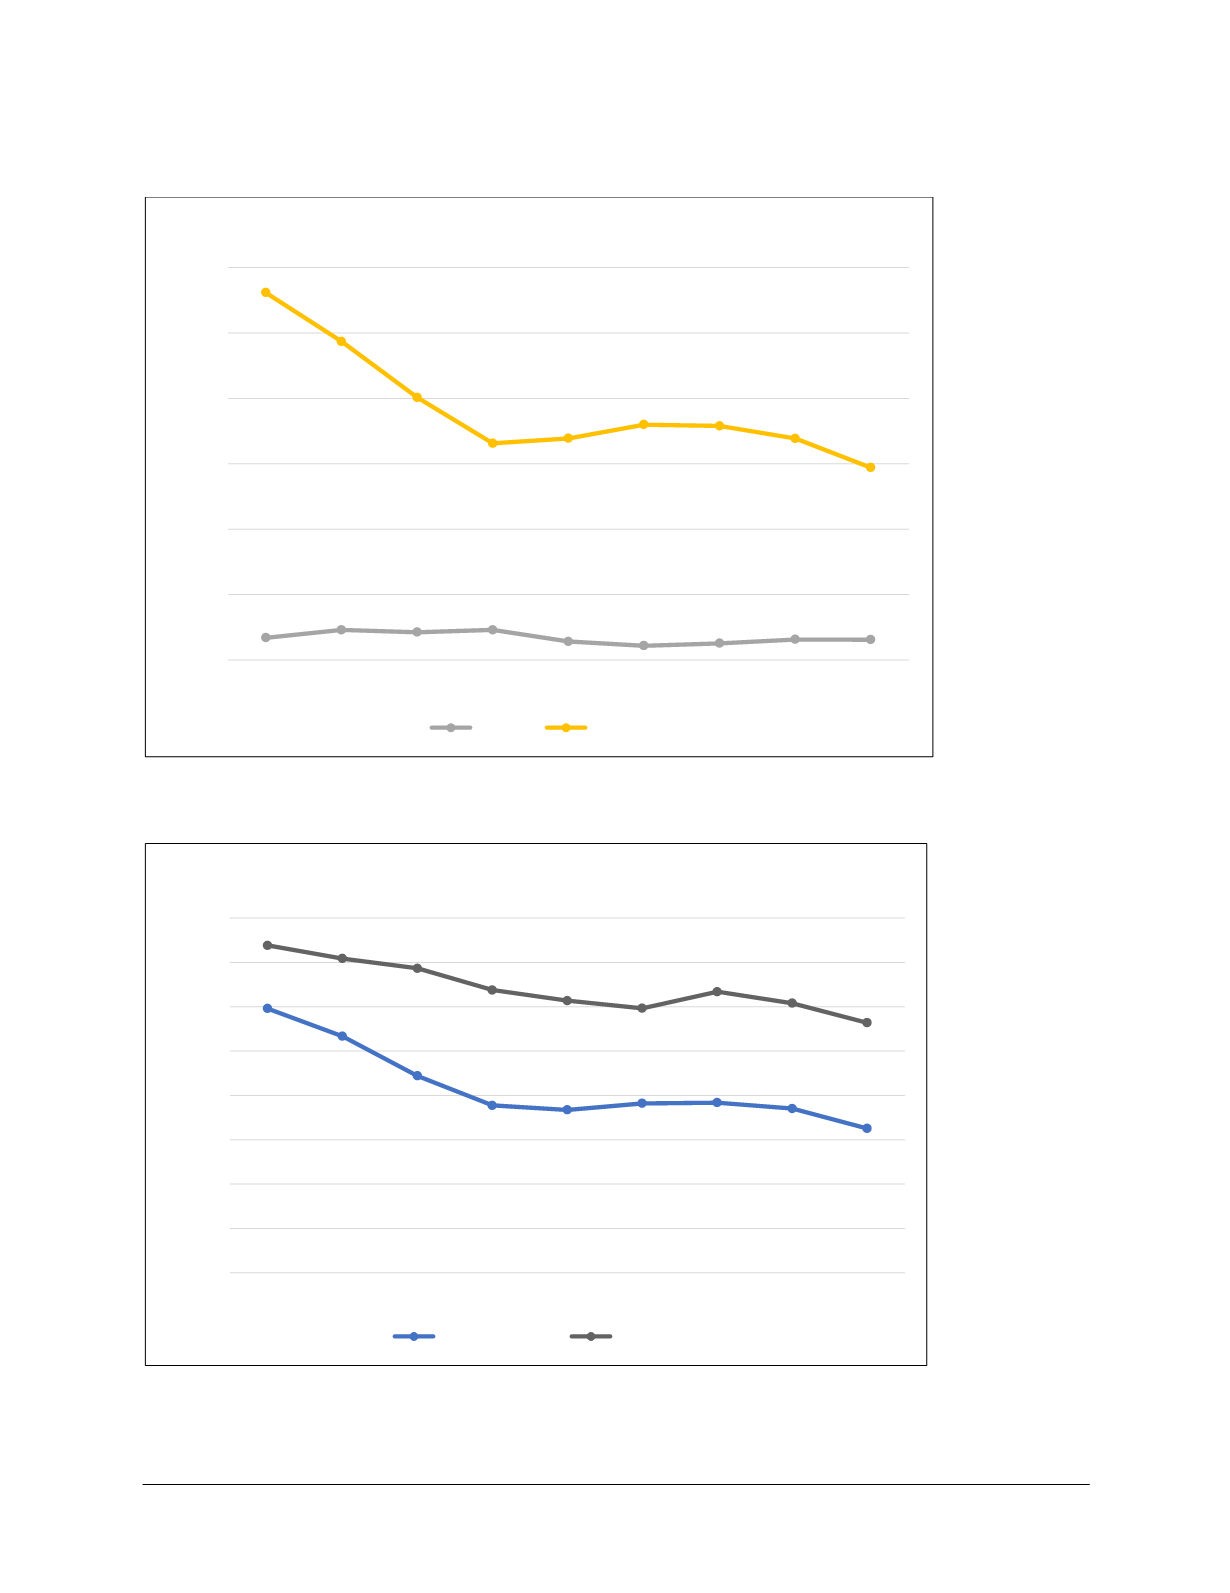
FIGURE 8-31: Reported Violent and Property Crime Rates, by Year
FIGURE 8-32: Reported Municipal and State Crime Rates, by Year
0.0
500.0
1,000.0
1,500.0
2,000.0
2,500.0
3,000.0
2006 2007 2008 2009 2010 2011 2012 2013 2014
Morgan Hill City Crime Rates By Year
Violent
Property
0.0
500.0
1,000.0
1,500.0
2,000.0
2,500.0
3,000.0
3,500.0
4,000.0
2006 2007 2008 2009 2010 2011 2012 2013 2014
Morgan Hill and California Total Crime Rates
Morgan Hill PD
California