


 258-259 / 260

Police Operations and Data Analysis Report, Morgan Hill, California
120
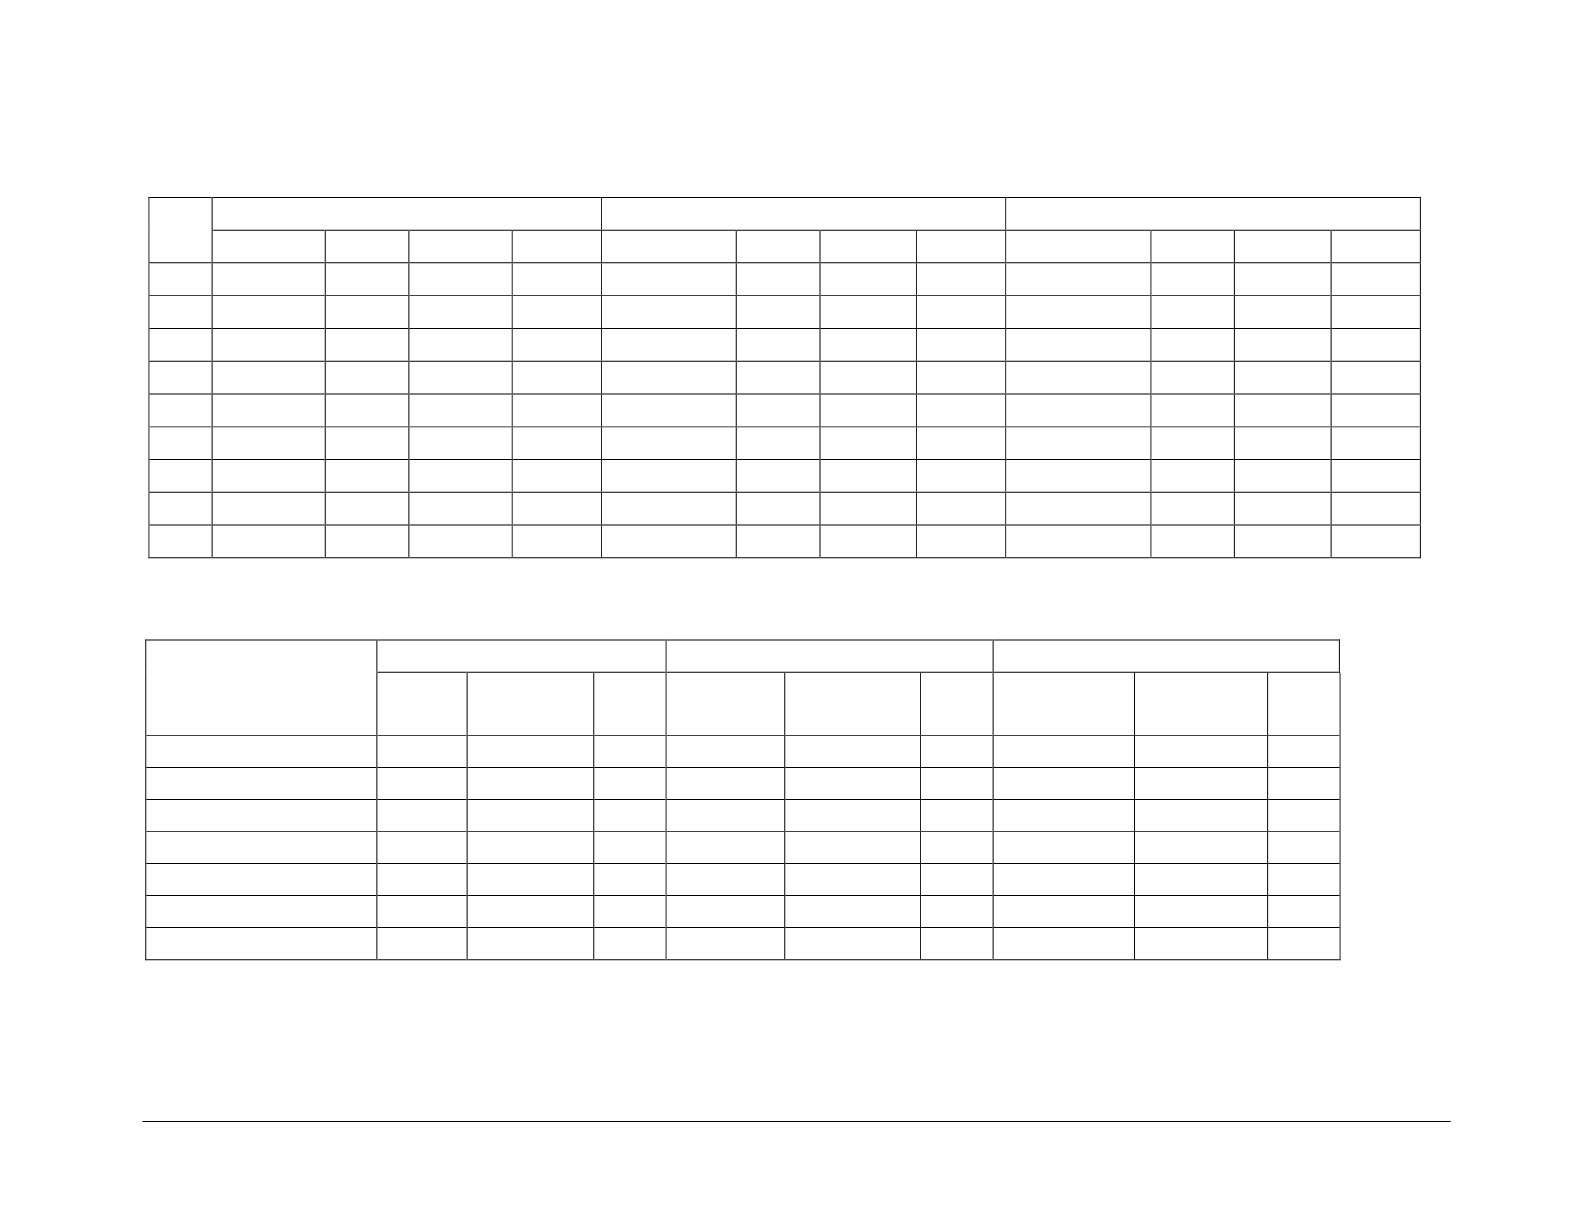
TABLE 8-22: Reported Municipal, State, and National Crime Rates, by Year
Year
Morgan Hill
California
National
Population Violent Property
Total
Population
Violent Property
Total
Population
Violent Property
Total
2006
35,166
171
2,810
2,980
36,572,532
531
3,161
3,692
304,567,337
448
3,103
3,551
2007
36,415
231
2,436
2,666
36,672,767
521
3,023
3,544
306,799,884
442
3,045
3,487
2008
38,051
213
2,008
2,221
36,876,276
502
2,931
3,433
309,327,055
438
3,055
3,493
2009
38,568
231
1,657
1,888
37,061,435
471
2,717
3,188
312,367,926
416
2,906
3,322
2010
37,882
143
1,695
1,837
37,346,022
439
2,629
3,068
314,170,775
393
2,833
3,225
2011
38,327
110
1,800
1,910
37,819,249
410
2,574
2,983
317,186,963
376
2,800
3,176
2012
38,834
129
1,790
1,918
38,183,375
421
2,747
3,169
319,697,368
377
2,758
3,135
2013
39,907
158
1,694
1,852
38,498,377
394
2,646
3,041
321,947,240
362
2,627
2,989
2014
41,585
156
1,472
1,628
38,970,399
389
2,430
2,819
324,699,246
357
2,464
2,821
TABLE 8-23: Reported Morgan Hill, California, and National Clearance Rates in 2014
Crime
Morgan Hill
California
National
Crimes Clearances
Rate
(%)
Crimes
Clearances
Rate
(%)
Crimes
Clearances
Rate
(%)
Aggravated Assault
41
33
80
91,790
51,565
56
718,857
387,980
54
Burglary
119
24
20
202,632
28,832
14
1,670,138
219,339
13
Larceny
372
51
14
592,565
93,965
16
5,654,125
1,255,387
22
Murder Manslaughter
0
0
NA
1,717
1,107
64
14,590
9,025
62
Rape
3
0
0
9,399
3,923
42
108,388
39,675
37
Robbery
21
6
29
48,673
14,956
31
318,768
89,962
28
Vehicle Theft
121
11
9
151,826
12,351
8
674,711
83,820
12