


 100 / 122

100 |
Southern Corridor GRIP 2017–2026
7.3 Security of Supply analysis
In this paragraph we present the Remaining Flexibility of the various countries of the
Region under the scenarios combining years, infrastructure level and disrupted
source listed in the Table 7.1.
The Figures in this paragraph are maps where the colour of each country corresponds
to a level of Remaining Flexibility or Disrupted Rate and where flows are represented
by arrows: thickness of arrow responds to flow, and utilisation of maximum capacity
is indicated by traffic lights.
20–40%
<20%
<40%
10–30%
>20%
0–50GWh/d
0–80% of capacity
50–250GWh/d
250–600GWh/d
600–1100GWh/d
>1100GWh/d
<30%
80–99% of capacity
99–100% of capacity
20–40%
<20%
<40%
10–30%
>20%
0–50GWh/d
0–80% of capacity
50–250GWh/d
250–600GWh/d
600–1100GWh/d
>1100GWh/d
<30%
80–99% of capacity
99–100% of capacity
20–40%
<20%
<40%
10–30%
>20%
0–50GWh/d
0–80% of capacity
50–250GWh/d
250–600GWh/d
600–1100GWh/d
>1100GWh/d
<30%
80–99% of capacity
99–100% of capacity
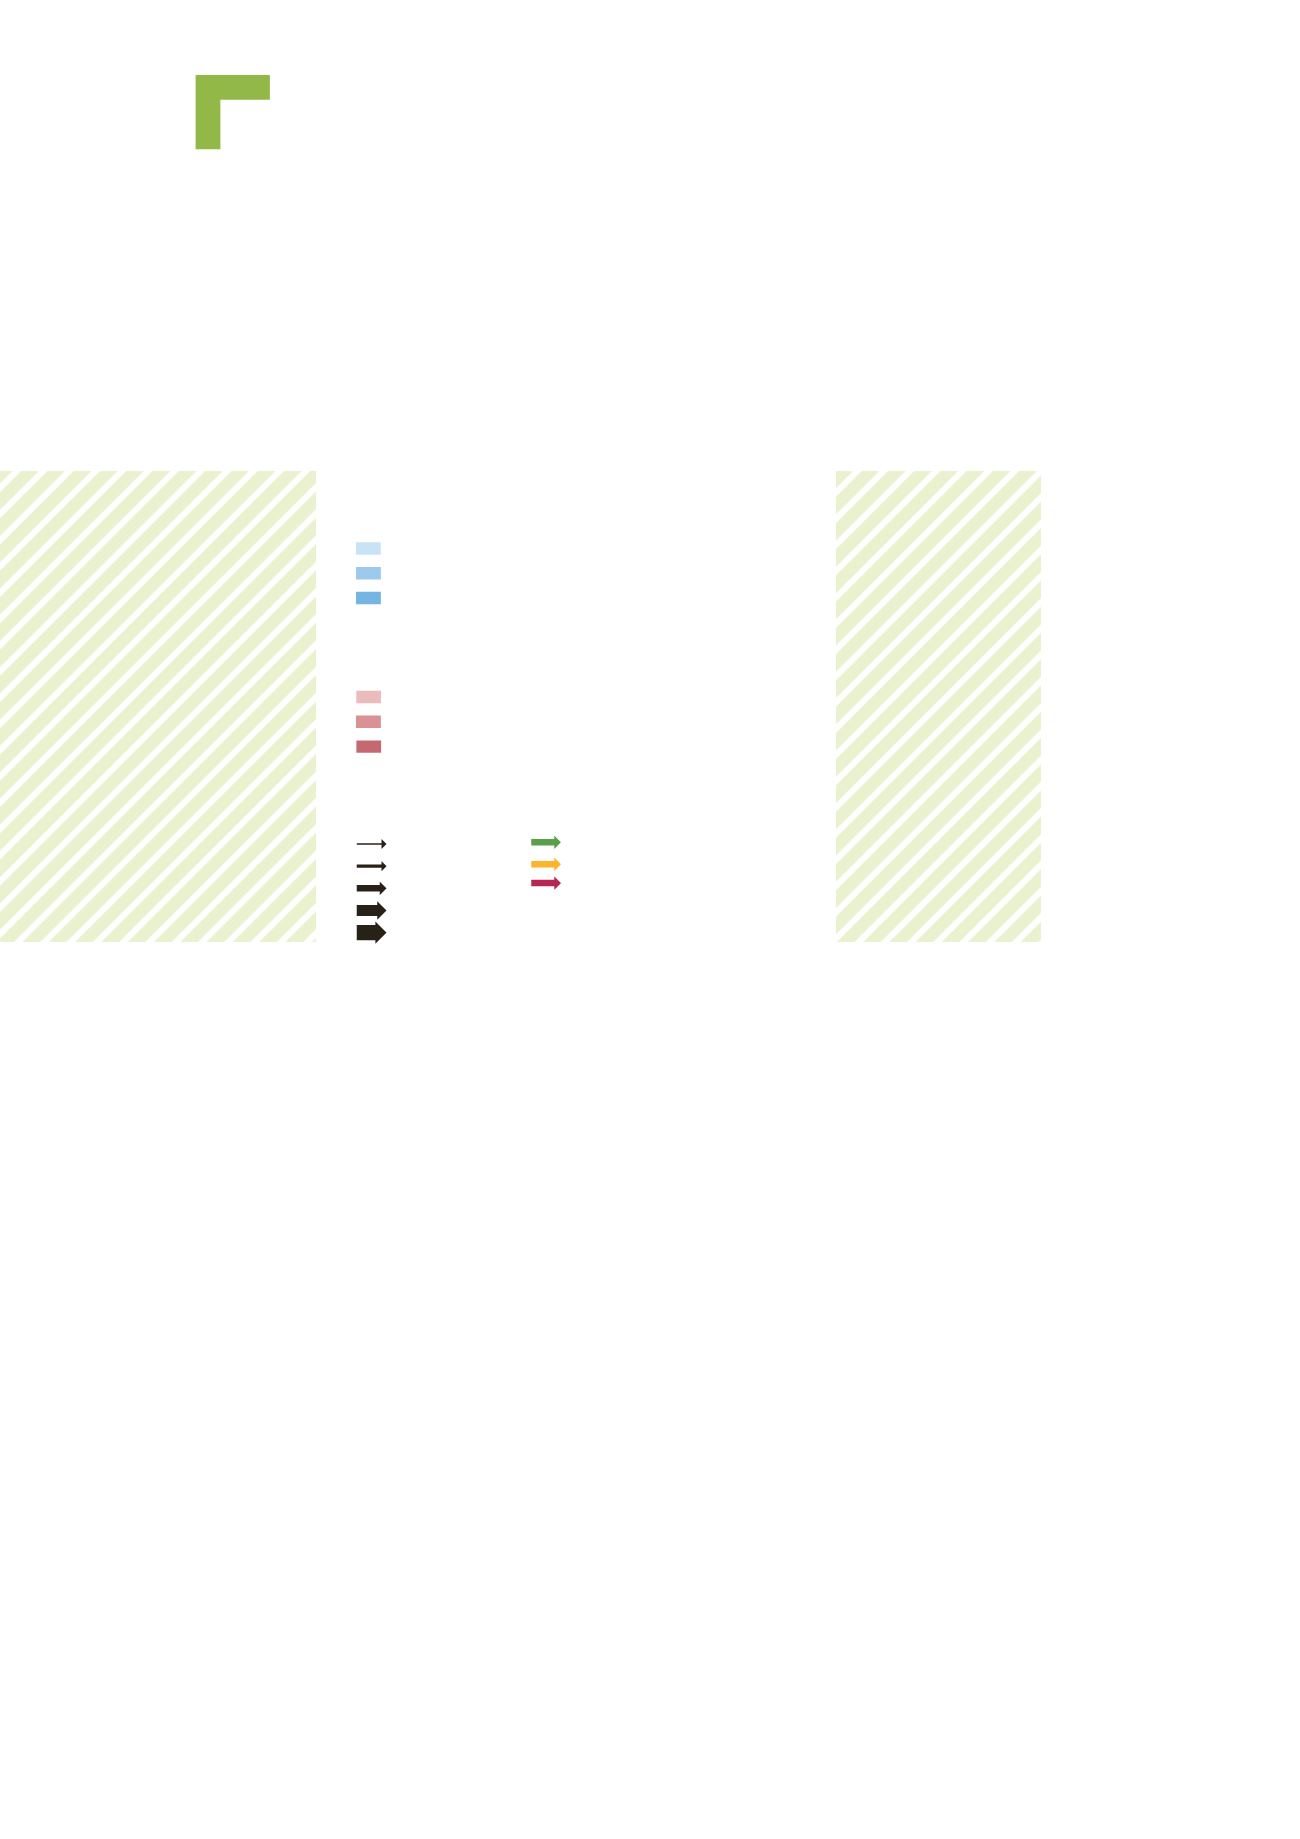
The remaining flexibility level is indicated by the
following colours:
and the disruption rate level by the following colours
The arrows correspond to the following legend: