


 8 / 204

2013 Best
Practices Study
Agencies
with
Revenues
Under
$1,250,000
8
Analysis of Agencies with Revenues Under $1,250,000
Key Benchmarks
Mgmt. Perspectives
Profile
Revenues
Expenses
Profitability
Employee Overview
Producer Info
Service Staff Info
Technology
Insurance Carriers
Appendix
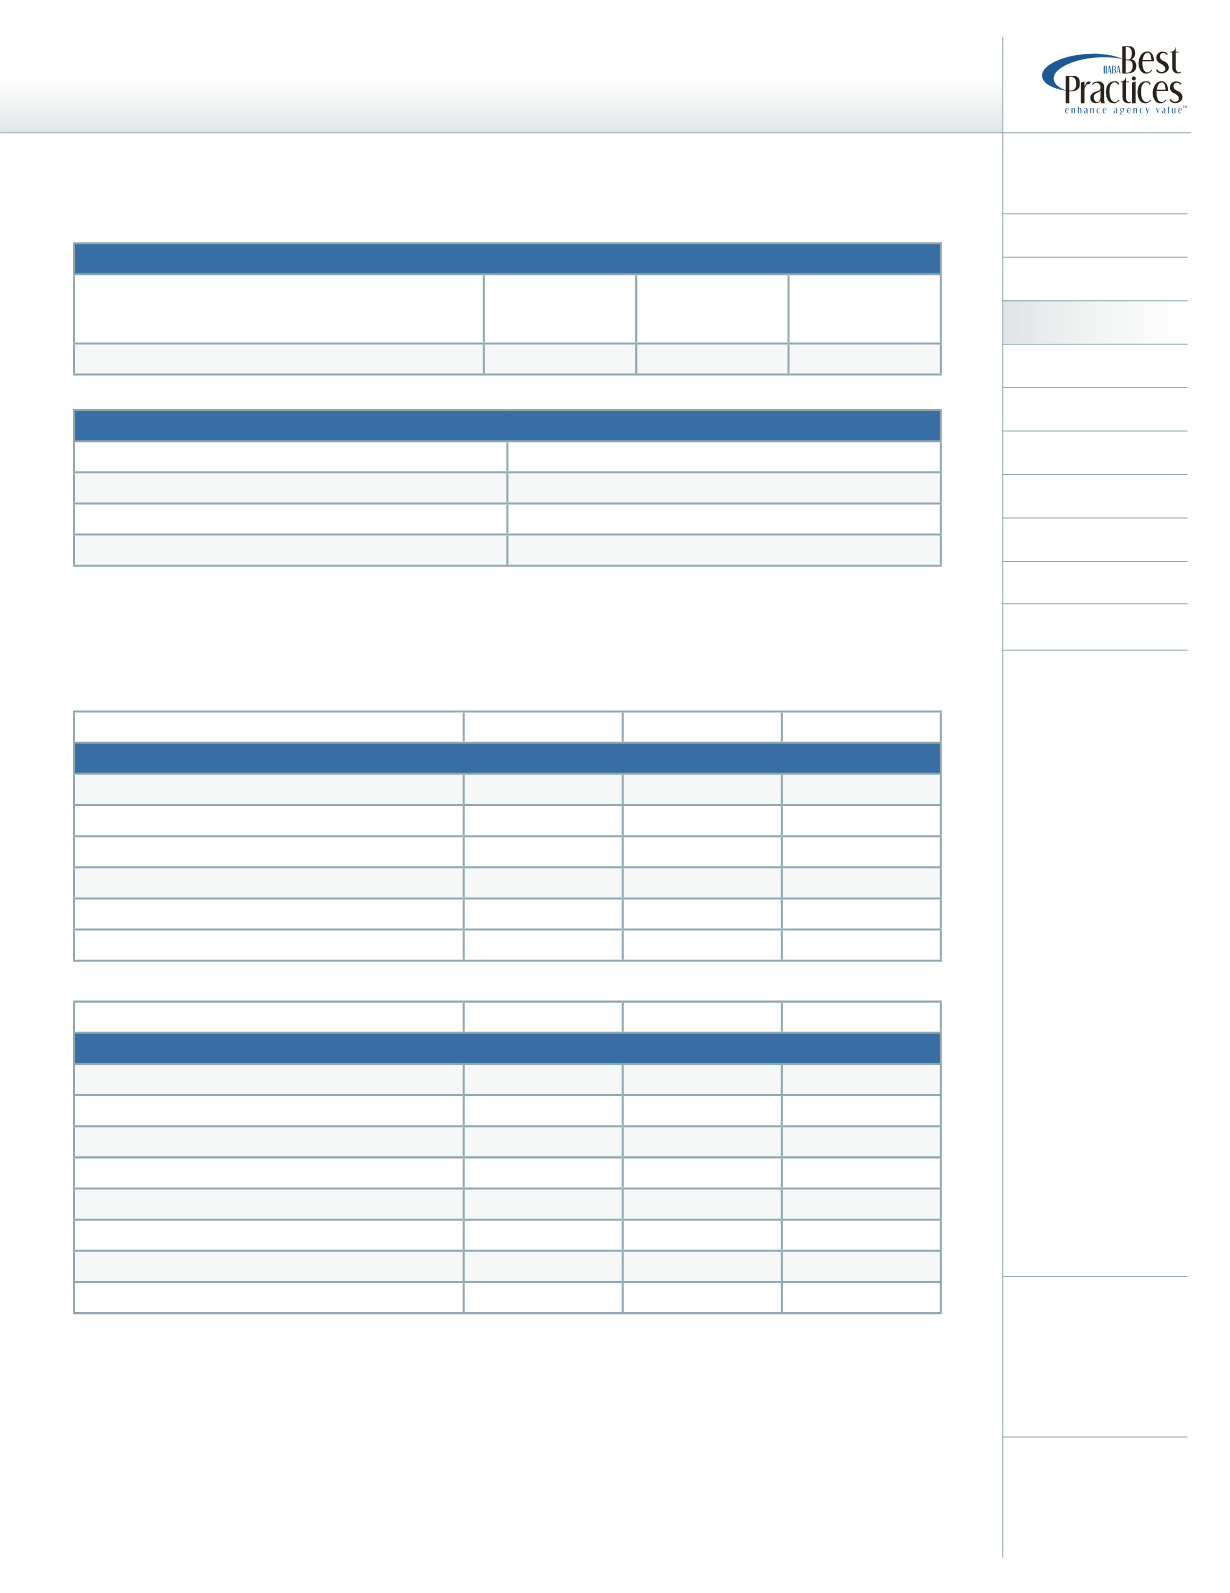
Revenue by Account Concentration
Average
+25% Profit
+25% Growth
% of Revenue Derived from:
Largest Account
5.5%
2.4%
6.5%
High
23.4%
Low
0.5%
10 Largest Accounts
15.8%
10.1%
16.3%
High
46.4%
Low
1.1%
Average
+25% Profit
+25% Growth
“Other” Group Life & Health* Revenue (% from source)
Life
47.5%
39.0%
*
Disability
3.6%
0.7%
*
Dental & Vision
23.5%
0.7%
*
Retirement/Pension
1.1%
3.3%
*
Worksite/Voluntary/Supplement
5.6%
0.0%
*
Long-Term Care
6.7%
20.0%
*
Employee Benefits TPA
12.1%
36.3%
*
All Other
0.0%
0.0%
*
What the Typical Transactions Looked Like
Revenues Acquired per Transaction
Multiples of Revenue Paid
Average
*
Average
*
High
*
High
*
Low
*
Low
*
Acquired Revenues
% of Agencies
Acquiring
Average
Commissions
Acquired
% of
Net Revenues
Acquisitions Made in Last 12 Months
6.1%
*
*
Revenue by Acquisition
*Insufficient Data
*Excludes Group Medical
*Insufficient Data