


 130-131 / 176

ACCOUNTS
UPM Annual Report 2016
UPM Annual Report 2016
130
131
In brief
Strategy
Businesses
Stakeholders
Governance
Accounts
CONTENTS
5.
Capital structure
UPM has a strong cash flow and industry-leading balance sheet that mitigates risks and enables value-enhancing strategic actions.
5.1 Capital management
UPM’s objective for managing capital comprising of net debt and
total equity is to ensure maintenance of flexible capital structure to
enable the ability to operate in capital markets and maintain optimal
returns to shareholders. The group manages its financing activities,
debt portfolio and financial resources via various policies that are
designed to ensure optimum financing arrangements minimising
simultaneously financial expenses and refinancing risk and optimising
liquidity. Borrowing activities are centralised to the parent to the
extent possible and cash resources are distributed within the group
by the central treasury department.
UPM targets a net debt to EBITDA ratio of approximately 2 times
or less.
EURm
2016
2015
Equity attributable to owners of the parent
company
8,234
7,942
Non-controlling interest
3
2
Total equity
8,237
7,944
Non-current debt
1,835
2,797
Current debt
585
269
Total debt
2,419
3,066
Total capitalisation
10,657 11,010
Total debt
2,419
3,066
Less: Interest-bearing financial assets
–1,289
–966
Net debt
1,131
2,100
Gearing ratio, %
1)
14
26
Net debt to EBITDA
1)
0.73
1.56
1)
Refer Note 10.2
, Alternative performance measures
Liquidity and refinancing risk
UPM seeks to maintain adequate liquidity under all circumstances
by means of efficient cash management and restricting financial
investments to investment types that can readily be converted into
cash. Adequate liquidity is maintained by keeping sufficient amount
of unused committed credit lines as a reserve.
Refinancing risks are minimised by ensuring a balanced loan
portfolio maturing schedule and sufficiently long maturities.
The average loan maturity at 31 December 2016 was 5.3 years
(5.5 years).
UPM has some financial agreements which have gearing as
a financial covenant whereby it should not exceed 110%
EURm
2016
2015
Cash at bank
590
545
Cash equivalents
402
81
Committed credit lines
656
1,025
of which used
–5
–
Used uncommitted credit lines
–26
–103
Long-term loan repayment cash flow
–477
–145
Liquidity
1,140
1,403
Cash and cash equivalents comprise cash in hand, deposits held
at call with banks and other short-term highly liquid investments
with original maturities of three months or less. Bank overdrafts are
included in used uncommitted credit lines and presented within
current debt in the balance sheet.
The most important financial programmes in use are:
Committed:
– Bilateral revolving credit lines.
Uncommitted:
– Domestic commercial paper programme, EUR 1,000 million.
EURm
2017
2018
2019
2020
2021
2022+
TOTAL
Bonds
292
237
–
–
–
356
885
Loans from financial institutions
21
305
320
16
10
14
685
Pension loans
74
74
–
–
–
–
148
Finance leases
88
7
8
49
5
37
195
Other loans
1
4
1
1
–
173
180
Current loans
26
–
–
–
–
–
26
Principal payments
502
628
328
65
15
581
2,118
Interest payments
88
50
41
36
35
218
468
EURm
18 19 20 21 22+
17
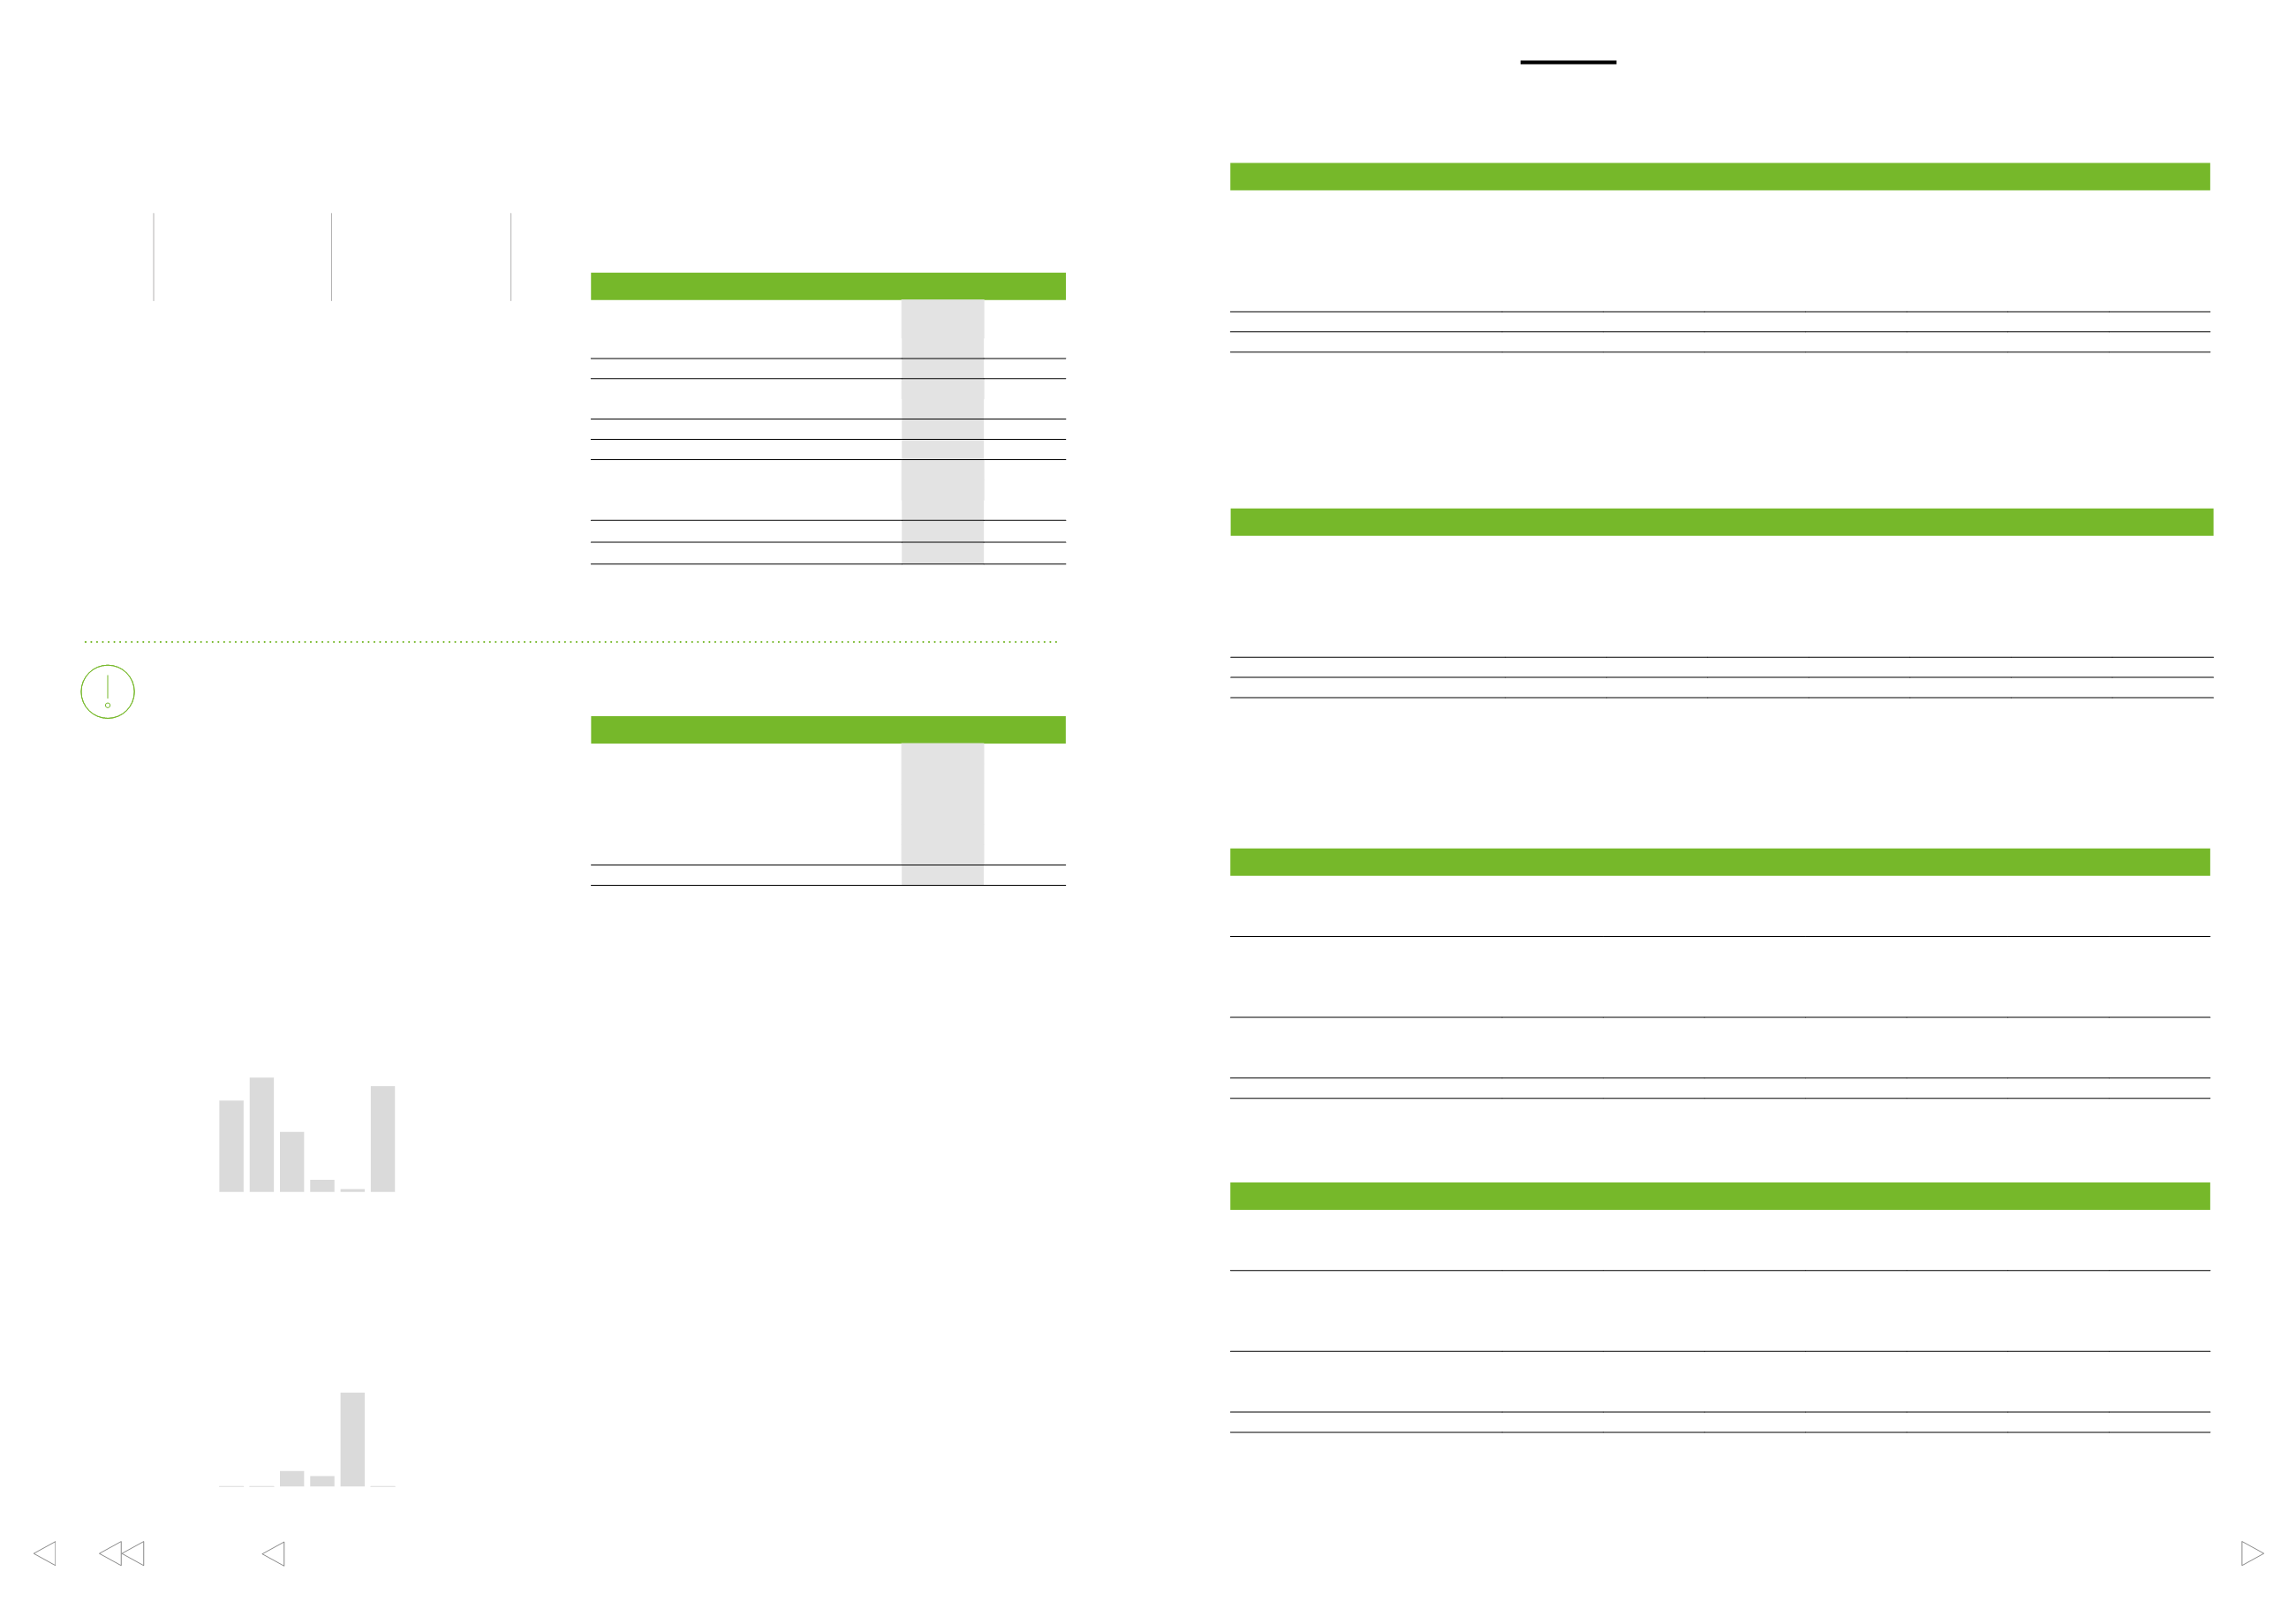
Repayments of debt
at the end of 2016
750
600
450
300
150
0
EURm
18 19 20 21
17
22+
■
Repayment
■
Committed credit lines’
maturities (EUR 656 million)
at the end of 2016
750
600
450
300
150
0
EURm
2016
2017
2018
2019
2020
2021+
TOTAL
Bonds
–
340
230
–
–
421
991
Loans from financial institutions
37
208
313
453
19
26
1,056
Pension loans
74
74
74
–
–
–
222
Finance leases
32
86
5
6
47
22
198
Other loans
2
2
2
–
1
163
170
Current loans
103
–
–
–
–
–
103
Principal payments
248
710
624
459
67
632
2,740
Interest payments
101
96
56
42
37
271
603
The difference between the above nominal values and carrying value of total debt arise from fair value adjustments increasing carrying value by
EUR 256 million and other non-cash adjustments decreasing carrying value by EUR 22 million.
UPM’s capital
Liquidity
Maturity table of debt at the end of 2016
Maturity table of debt at the end of 2015
The difference between the above nominal values and carrying value of total debt arise from fair value adjustments increasing carrying value by
EUR 202 million and other non-cash adjustments decreasing carrying value by EUR 18 million.
Maturity table of derivatives and guarantees at the end of 2016
EURm
2017
2018
2019
2020
2021
2022+
TOTAL
Net settled interest rate swaps
Net inflow
52
23
14
13
12
66
180
Net outflow
–8
–7
–8
–6
–5
–4
–38
Gross settled derivatives:
Gross currency swaps
Total inflow
302
101
9
7
7
226
652
Total outflow
–371
–78
–1
–2
–2
–193
–647
Forward foreign exchange contracts
Total inflow
369
–
–
–
–
–
369
Total outflow
–368
–
–
–
–
–
–368
Guarantees
2
–
–
–
–
–
2
Maturity table of derivatives and guarantees at the end of 2015
EURm
2016
2017
2018
2019
2020
2021+
TOTAL
Net settled interest rate swaps
Net inflow
54
53
23
11
12
82
235
Net outflow
–7
–7
–5
–6
–2
–
–27
Gross settled derivatives:
Gross currency swaps
Total inflow
18
354
101
12
10
325
820
Total outflow
–8
–374
–82
–5
–6
–335
–810
Forward foreign exchange contracts
Total inflow
671
–
–
–
–
–
671
Total outflow
–673
–
–
–
–
–
–673
Guarantees
4
–
–
–
–
–
4
Net debt
EUR
1,131m
(EUR 2,100m)
Free cash flow
EUR
1,424m
(EUR 750m)