


 166-167 / 176

UPM Annual Report 2016
UPM Annual Report 2016
166
167
In brief
Strategy
Businesses
Stakeholders
Governance
ACCOUNTS
CONTENTS
11 12 13 14 15 16
07
10 09 08
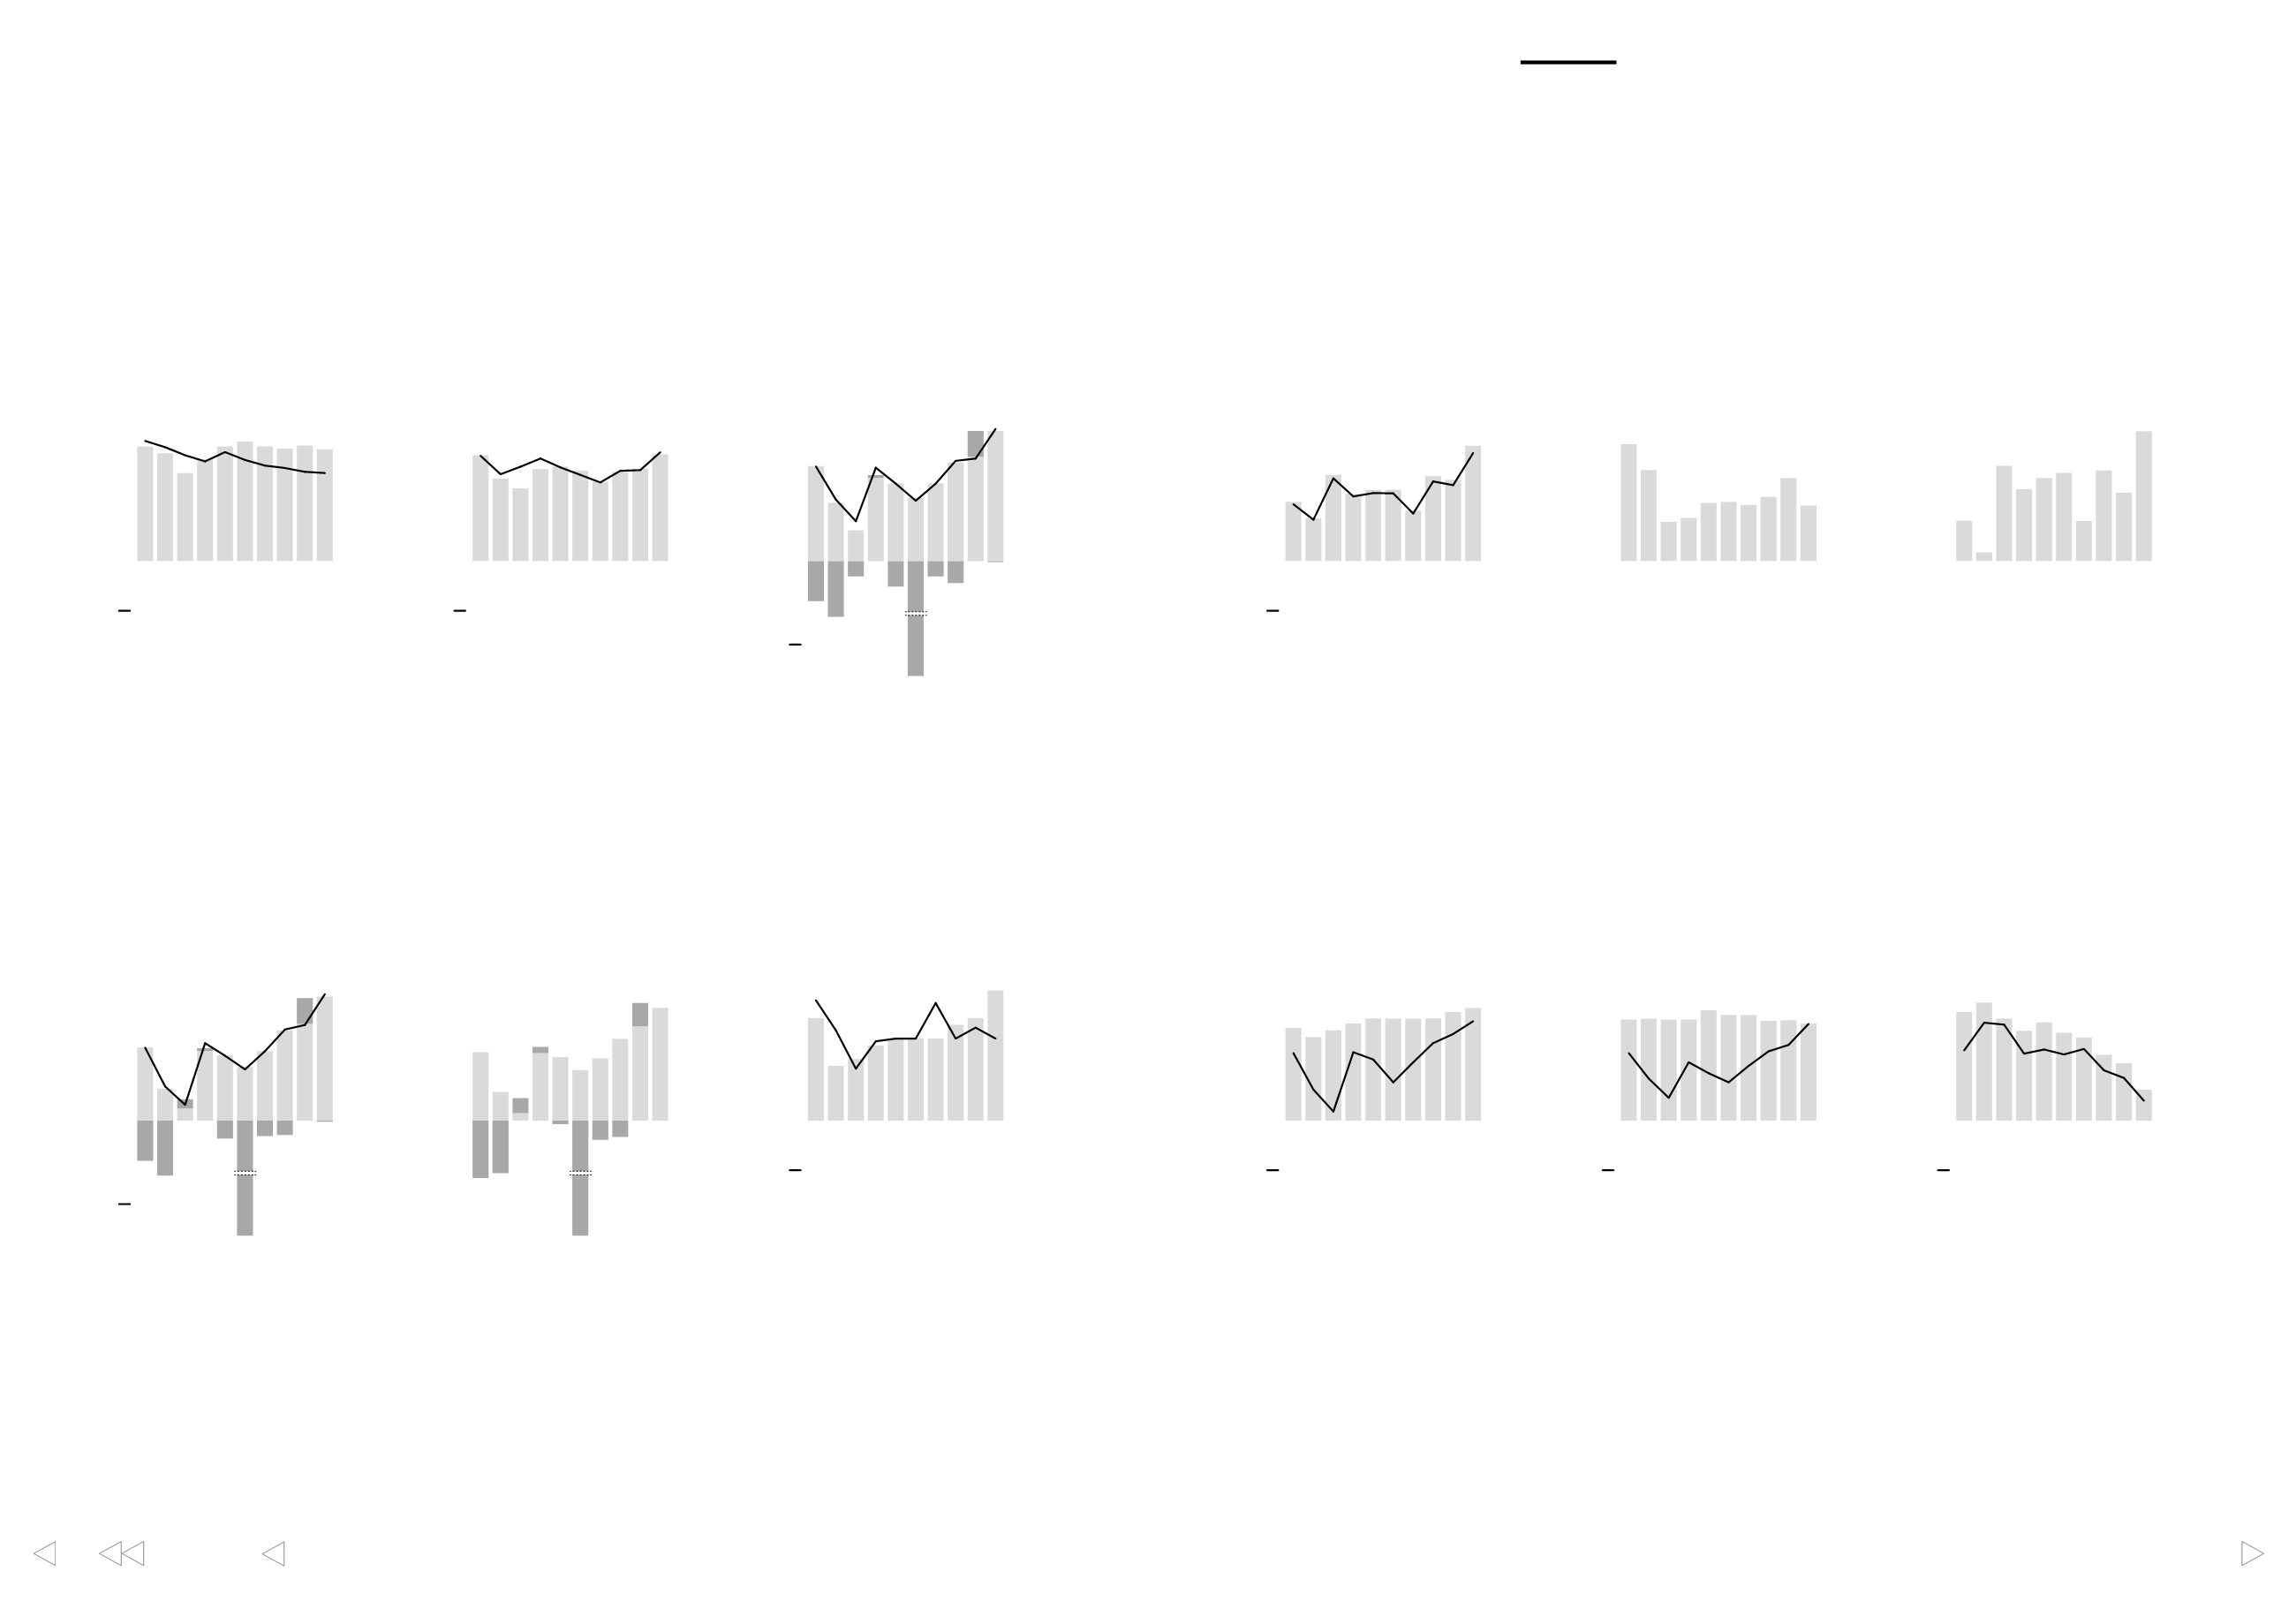
12,000
10,000
8,000
6,000
4,000
2,000
0
Sales and personnel
■
Sales
Personnel
30,000
25,000
20,000
15,000
10,000
5,000
0
employees
EURm
11 12 13 14 15 16
07
10 09 08
2,000
1,600
1,200
800
400
0
Comparable EBITDA
■
Comparable EBITDA
% of sales
20
16
12
8
4
0
%
EURm
11 12 13 14 15 16
07
10 09 08
2,000
1,500
1,000
500
0
Operating cash flow
■
Operating cash flow
Per share
4
3
2
1
0
EUR
EURm
11 12 13 14 15 16
07
10 09 08
10,000
8,000
6,000
4,000
2,000
0
Equity and ROE
■
Equity
Comparable ROE
15
12
9
6
3
0
%
EURm
11 12 13 14 15 16
07
10 09 08
15,000
12,000
9,000
6,000
3,000
0
Capital employed and ROCE
■
Capital employed
Comparable ROCE
15
12
9
6
3
0
%
EURm
11 12 13 14 15 16
07
10 09 08
5,000
4,000
3,000
2,000
1,000
0
Net debt
and net debt to EBITDA
■
Net debt
Net debt to EBITDA
5
4
3
2
1
0
EUR
EURm
11 12 13 14 15 16
07
10 09 08
Capital expenditure
excluding acquisitions and shares
EURm
800
600
400
200
0
11 12 13 14 15 16
07
10 09 08
1,500
1,200
900
600
300
0
Free cash flow
EURm
11 12 13 14 15 16
07
10 09 08
1,200
1,000
800
600
400
200
0
Operating profit
■
Comparable EBIT
% of sales
■
Items affecting comparability
12
10
8
6
4
2
0
%
EURm
11 12 13 14 15 16
07
10 09 08
1,200
1,000
800
600
400
200
0
Profit before tax
■
Comparable profit before tax
% of sales
■
Items affecting comparability
12
10
8
6
4
2
0
%
EURm
11 12 13 14 15 16
07
10 09 08
2.0
1.5
1.0
0.5
0
Earnings per share
■
Comparable EPS
■
Effect of items affecting comparability
EUR
11 12 13 14 15 16
07
10 09 08
1.0
0.8
0.6
0.4
0.2
0
Dividend per share
■
Dividend per share
Dividend to operating cash flow
50
40
30
20
10
0
%
EUR
In 2016 UPM has relabeled the previously referenced “excluding special items” non-GAAP financial measures with “comparable” performance measures.
Corresponding 2014 and 2015 group measures have been revised accordingly.
Financial information 2007–2016
Accounts