


 168-169 / 176

UPM Annual Report 2016
UPM Annual Report 2016
168
169
In brief
Strategy
Businesses
Stakeholders
Governance
Accounts
11 12 13 14 15 16
07
10 09 08
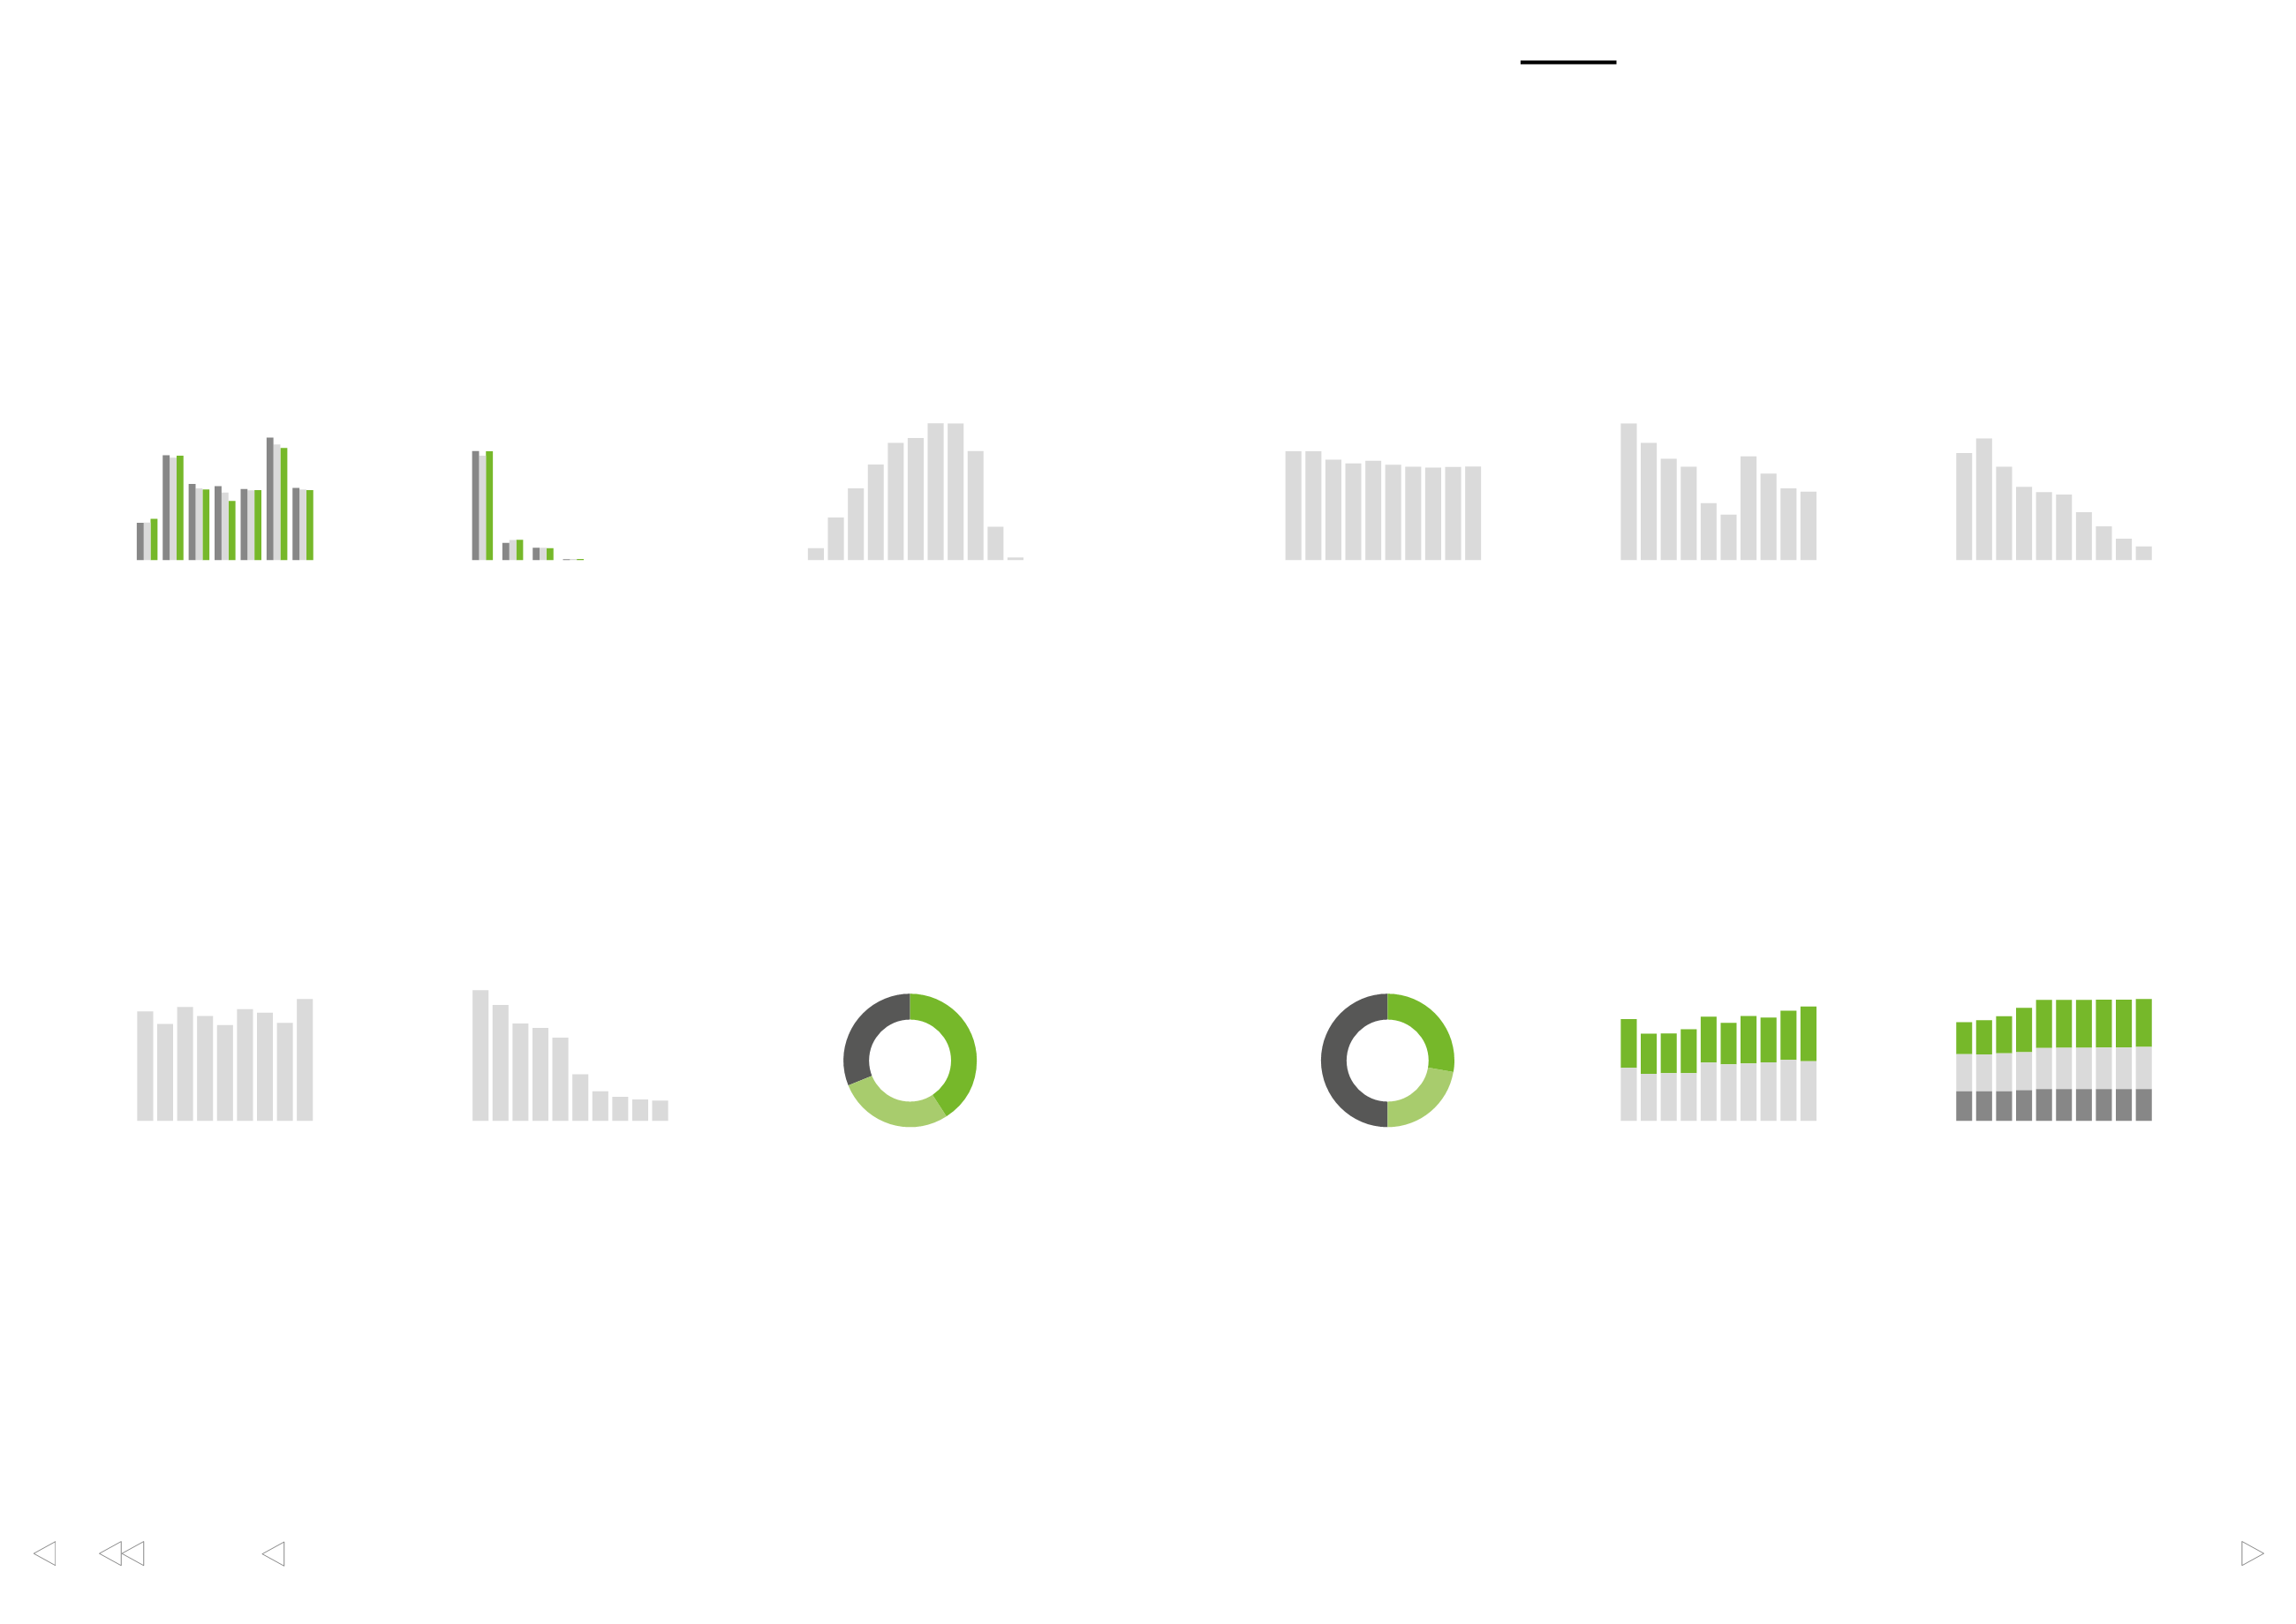
UPM’s electricity consumption
per tonne of paper
kWh/t
2,000
1,500
1,000
500
0
11 12 13 14 15 16
07
10 09 08
30
25
20
15
10
5
0
UPM’s solid waste to landfills
per tonne of converted product
kg/t
11 12 13 14 15 16
07
10 09 08
12
10
8
6
4
2
0
UPM’s solid waste to landfills
per tonne of paper
kg/t
11 12 13 14 15 16
07
10 09 08
800
600
400
200
0
UPM’s fossil carbon dioxide emissions
per tonne of paper
kg/t
■
CO
2
from purchased electricity
per tonne of paper
■
CO
2
from on-site energy generation
per tonne of paper
11 12 13 14 15 16
07
10 09 08
25
20
15
10
5
0
Lost-time accident frequency,
UPM workforce
120
100
80
60
40
20
0
Ratio of female to male salaries,
weighted basic salary 2016
UK
Germany
France
USA
Poland
Finland
Uruguay
China
Russia
%
11 12 13 14 15 16
07
10 09 08
2,500
2,000
1,500
1,000
500
0
UPM’s CO
2
emission-free
power generation capcaity
MW
■
Biomass
■
Hydro
■
Nuclear
Stationery fuel
combustion
Indirect emissions
from supply chain
Indirect emissions
from purchased power
Sources of UPM’s
greenhouse gas emissions*
)
, 2016
*
)
measured in CO
2
-equivalents
EU Eco-labeled sales
(incl. products with
multiple labelling)
Sales without
eco-labels
Other eco-labeled
sales (FSC, PEFC, SFI,
German Blue Angel)
UPM’s eco-labeled sales*
)
*
)
incl. Paper, Pulp, Plywood, Label material,
Timber and Biocomposites
The electricity consumption per
tonne of paper decreased by
14% over the last ten years due to
continuous improvements of energy
efficiency.
Solid waste to landfills per tonne
of converted product decreased by
87% over the last ten years. Since
2007, the figure includes UPM
Raflatac’s label products only.
Compared to the previous year
UPM’s overall greenhouse gas
emissions have remained about the
same. According to the calculation,
approximately 50% of the direct
and indirect greenhouse gas
emissions are related to UPM’s
energy use, but raw materials,
transportation and processing of
sold products also have a significant
impact. More details are available
at
www.upm.com/responsibility.In 2016 on-site CO
2
emissions
(Scope 1) decreased mainly
because of change in energy
supply at UPM Hürth mill. CO
2
of purchased electricity (Scope 2)
increased mainly due to higher CO
2
factors in Germany and Finland.
UPM’s capacity for CO
2
emission-
free power generation has
increased over the last ten years.
In 2016, 69% (70%) of UPM’s
overall sales of paper, chemical
pulp, plywood, label material,
timber and biocomposite products
was ecolabelled. This figure
includes FSC, PEFC and EU
Ecolabels, and national ecolabels.
Compared to previous year’s
reporting the scope has widened to
include label material sales. UPM
aims to have all applicable products
ecolabelled by 2030.
Lost-time accident frequency (LTAF)
is the number of lost-time accidents
per one million hours of work. LTAF
improved significantly over the last
ten years.
The ratio is calculated by comparing
weighted average of basic salaries
of women to men on the same
job grades, for the nine biggest
countries in terms of salaried
employees. These countries cover
90% of UPM's total number of
salaried employees.
The amount of solid waste sent to
landfills has decreased by 50%
over the last ten years. However,
from 2012 to 2013, the amount
increased significantly. This is due to
the fact that former reuse possibilities
for ash ceased at one of UPM’s
paper mills. Starting from 2014,
new methods of recycling were
established, with further options for
recycling still being investigated.
persons
UPM workforce
by region
20,000
15,000
10,000
5,000
0
Asia
Americas
Europe
Rest of the
World
■
2014, total 20,414*
)
■
2015, total 20,184
■
2016, total 20,811
*
)
2014 figure for UPM employees, since 2015
for UPM workforce including employees and
supervised external workers
21–25
26–30
31–35
36–40
41–45
46–50
51–55
56–60
61–64
≥65
≤20
3,000
2,500
2,000
1,500
1,000
500
0
Age structure of UPM employees
2016
persons
1–5
6–10
11–15
16–20
21–30
>30
<1
persons
Employees’ years of service
with UPM
5,000
4,000
3,000
2,000
1,000
0
■
2014, total 20,414
■
2015, total 19,578
■
2016, total 19,310
More on responsibility
ACCOUNTS
CONTENTS