


 154-155 / 176

ACCOUNTS
UPM Annual Report 2016
UPM Annual Report 2016
154
155
In brief
Strategy
Businesses
Stakeholders
Governance
Accounts
CONTENTS
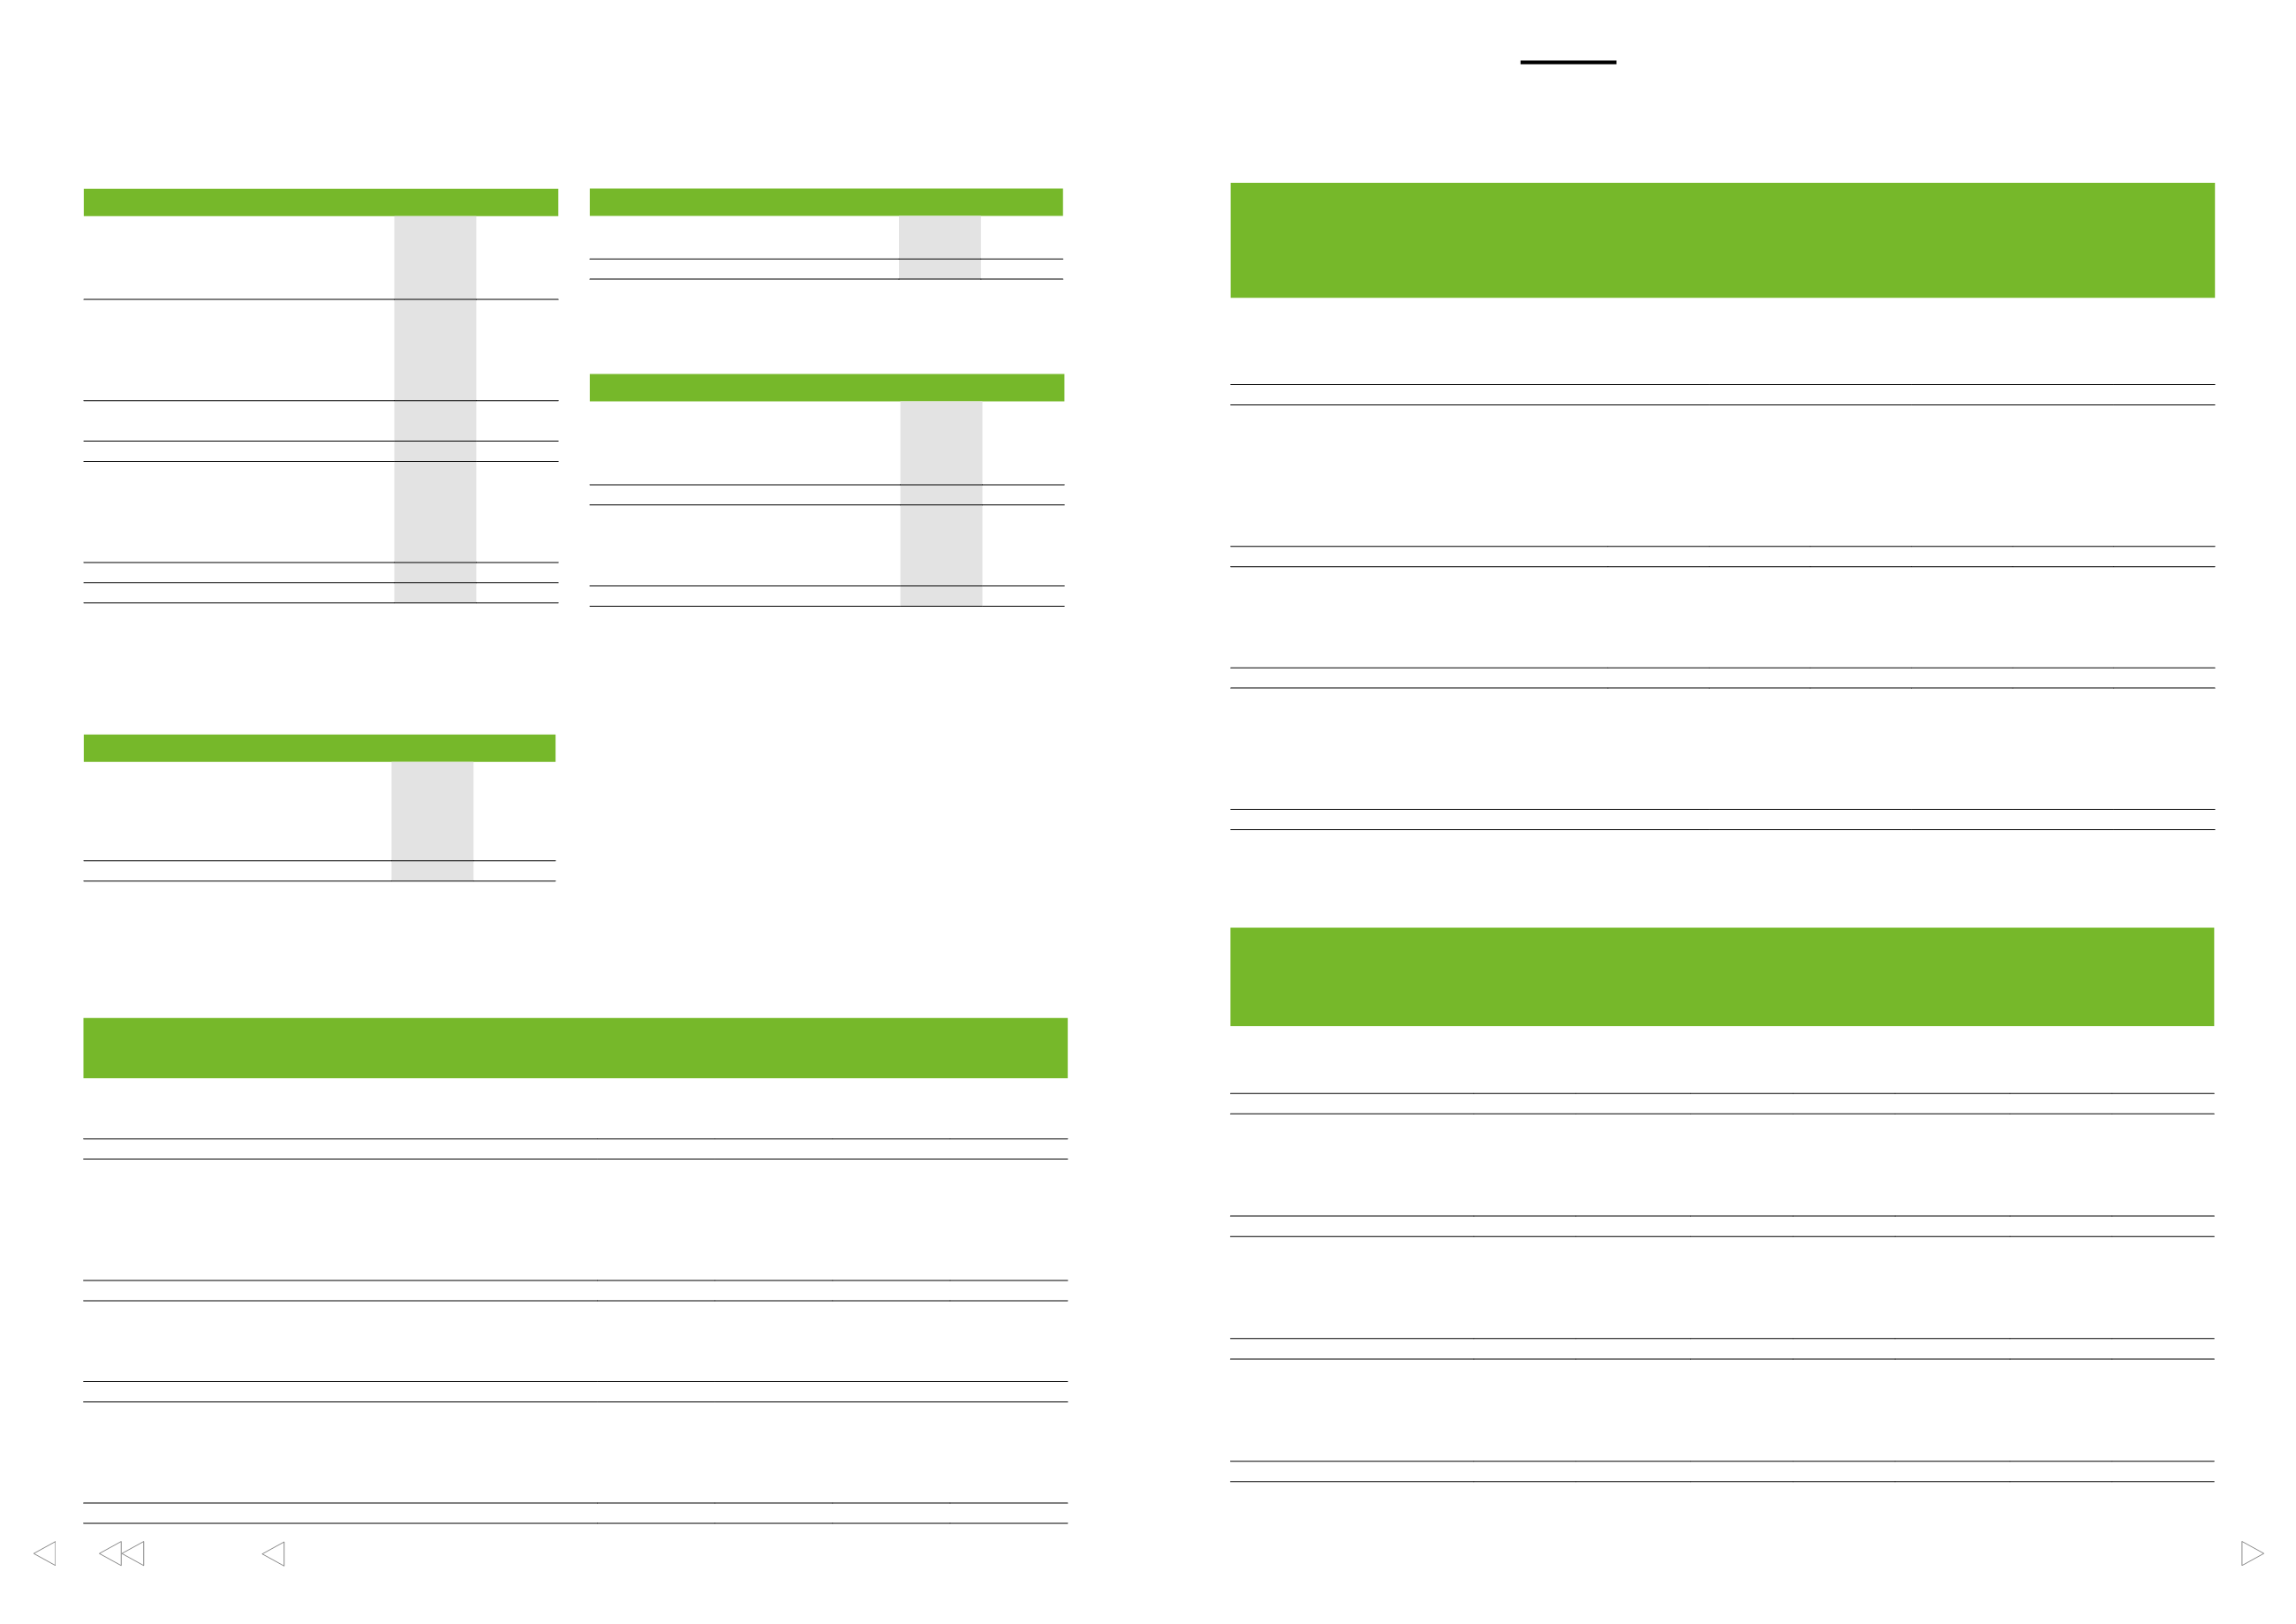
10. Intangible assets
EURm
INTANGIBLE
RIGHTS
OTHER
INTANGIBLE
ASSETS
ADVANCE
PAYMENTS
TOTAL
2016
Accumulated costs
13
282
5
300
Accumulated amortisation and impairments
–8
–257
–
–265
Carrying value, at 31 December
5
25
5
35
Carrying value, at 1 January
5
178
4
187
Additions
6
4
3
13
Disposals
–3
–141
–
–144
Amortisation
–3
–17
–
–19
Impairment
–
–2
–
–2
Reclassifications
–
2
–2
–
Carrying value, at 31 December
5
25
5
35
2015
Accumulated costs
19
523
4
546
Accumulated amortisation and impairments
–14
–345
–
–359
Carrying value, at 31 December
5
178
4
187
Carrying value, at 1 January
5
198
3
206
Additions
7
4
3
14
Disposals
–5
–1
–1
–7
Amortisation
–2
–24
–
–26
Reclassifications
–
1
–1
–
Carrying value, at 31 December
5
178
4
187
9.
Income taxes
EURm
2016
2015
Tax expense for the period
82
61
Tax expense for the previous periods
–1
–
Total
81
61
7.
Financial income and expenses
EURm
2016
2015
Income on non-current assets
Dividend income from group companies
80
182
Dividend income from other companies
1
–
Interest income from group companies
3
6
84
188
Other interest and financial income
Other interest income from group companies
19
3
Other financial income from group companies
35
29
Other financial income from other companies
13
–
68
32
Value adjustments
–6
105
Interest and other financial expenses
Interest expenses to group companies
–22
–34
Interest expenses to other companies
–29
–26
Other financial expenses to other companies
–90
–97
–141
–157
Total
6
168
8.
Closing entries
EURm
2016
2015
Change in accumulated depreciation
difference
11
44
Group contributions received
–1
–4
Group contributions granted
32
6
Losses from mergers
1
–
Total
42
46
EURm
2016
2015
Deferred tax assets
Provisions
34
12
Share-based payments
3
2
Other temporary differences
–
1
Total
37
15
Deferred tax liabilities
Accumulated depreciation difference
–91
–122
Revaluations of the land areas
–73
–117
Total
–164
–239
1)
The parent company has not recognised deferred tax assets and liabilities in
the balance sheet. Deferred tax assets and liabilities were calculated based on
temporary differences between the carrying and taxable values of assets and
liabilities.
Deferred tax assets and liabilities
1)
11. Tangible assets
EURm
LAND AND
WATER
AREAS BUILDINGS
MACHINERY
AND
EQUIPMENT
OTHER
TANGIBLE
ASSETS
ADVANCE
PAYMENTS
AND CON
STRUCTION
IN
PROGRESS
TOTAL
2016
Accumulated costs
449
604
2,026
138
36
3,254
Accumulated depreciation and impairments
–
–345
–1,396
–112
–
–1,852
Revaluations
364
–
–
–
–
364
Carrying value, at 31 December
813
259
630
27
36
1,766
Carrying value, at 1 January
891
443
868
37
23
2,262
Additions
8
25
117
2
61
213
Disposals
–29
–186
–270
–8
–7
–499
Depreciations
–
–27
–120
–6
–
–152
Impairment
–
–
1
–
–
1
Reclassifications
–
3
35
2
–41
–
Changes in revaluations
–57
–
–
–
–
–57
Carrying value, at 31 December
813
259
630
27
36
1,766
2015
Accumulated costs
470
1,242
5,027
198
23
6,960
Accumulated depreciation and impairments
–
–799
–4,159
–161
−
–5,119
Revaluations
421
–
–
–
–
421
Carrying value, at 31 December
891
443
868
37
23
2,262
Carrying value, at 1 January
934
441
720
38
209
2,342
Additions
8
12
64
3
78
165
Disposals
–15
–
–
−
−
–15
Depreciations
−
–33
–155
–6
−
–194
Reclassifications
–
23
239
2
–264
–
Changes in revaluations
–36
–
–
–
–
–36
Carrying value, at 31 December
891
443
868
37
23
2,262
12. Other non-current assets
EURm
HOLDINGS
IN GROUP
COMPANIES
HOLDINGS IN
PARTICIPATING
INTEREST
COMPANIES
OTHER
SHARES AND
HOLDINGS
RECEIVABLES
FROM
GROUP
COMPANIES
RECEIVABLES
FROM
PARTICIPATING
INTEREST
COMPANIES
OTHER
NON-
CURRENT
RECEIVABLES
TOTAL
2016
Accumulated costs
5,780
5
4
255
5
7
6,056
Accumulated value adjustments
–1,414
–
–
–
–
–
–1,414
Carrying value, at 31 December
4,365
5
4
255
5
7
4,642
Carrying value, at 1 January
3,984
93
614
723
6
7
5,427
Additions
829
1
–
3
–
–
832
Disposals
–442
–88
–446
–470
–1
–
–1,448
Changes in revaluations
–
–
–164
–
–
–
–164
Value adjustments
1)
–5
–
–1
–
–
–
–6
Carrying value, at 31 December
4,365
5
4
255
5
7
4,642
2015
Accumulated costs
5,393
93
450
723
6
7
6,672
Accumulated value adjustments
–1,409
–
–
–
–
−
–1,409
Revaluations
–
–
164
–
–
–
164
Carrying value, at 31 December
3,984
93
614
723
6
7
5,427
Carrying value, at 1 January
4,648
99
582
666
6
30
6,031
Additions
37
–
32
69
–
–
138
Disposals
–806
–6
–
–12
–
−21
–845
Reclassifications
–
–
–
–
–
–2
–2
Value adjustments
105
–
–
–
–
–
105
Carrying value, at 31 December
3,984
93
614
723
6
7
5,427
1)
Value adjustments are recognised under financial items.