


 4 / 168

2015 Best
Practices Study
Agencies
with
Revenues
Under
$1,250,000
4
Analysis of Agencies with Revenues Under $1,250,000
Key Benchmarks
Profile
Revenues
Expenses
Profitability
Employee Overview
Producer Info
Service Staff Info
Technology
Insurance Carriers
Appendix
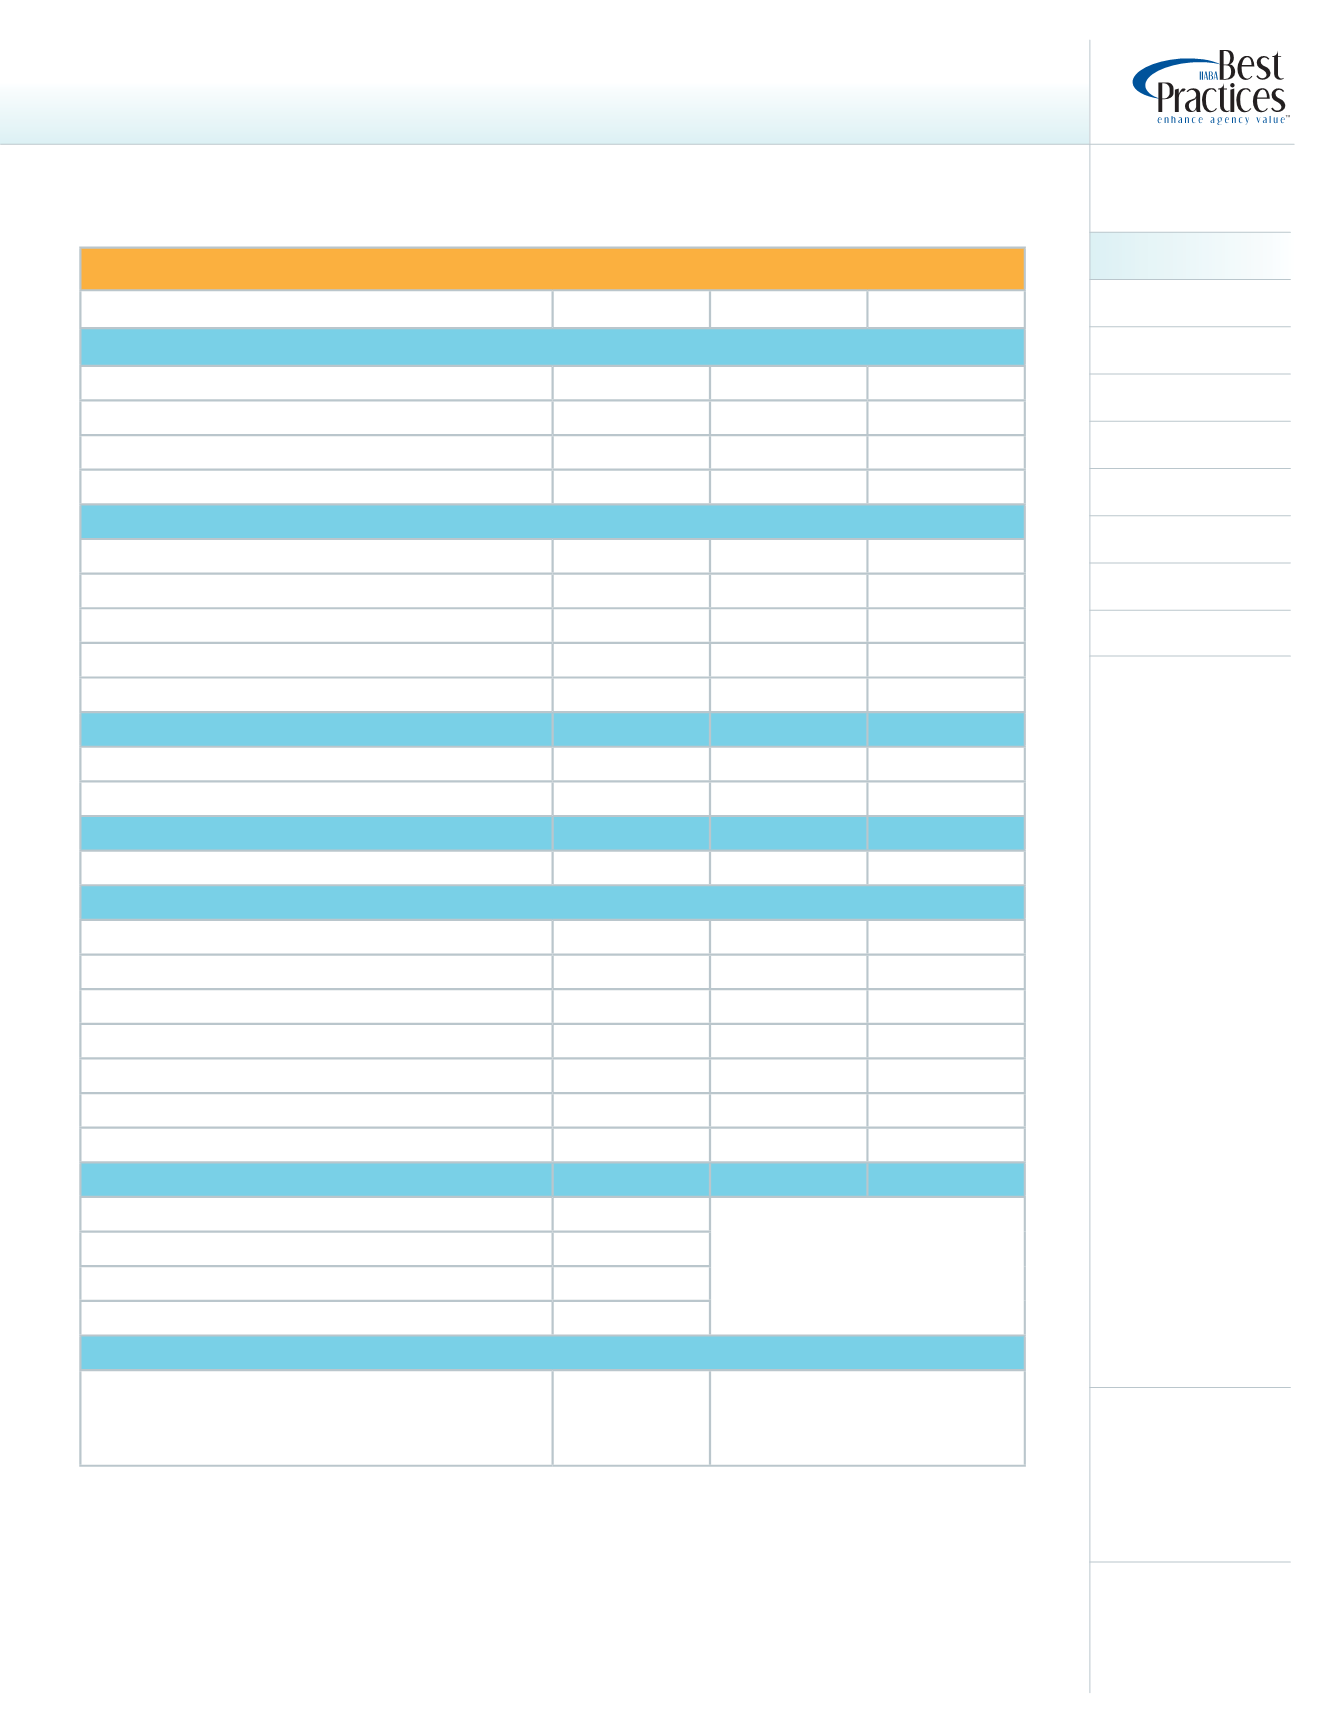
Note: See page 163 for an explanation of column headings
AVERAGE TOTAL REVENUES: $785,528
Average
Top 25% Pro!t Top 25%Growth
Population Density of Metropolitan AreasWhere Home O!ce is Located
Less than 50,000
60.9%
60.0%
60.0%
50,000 – 250,000
13.0%
0.0%
0.0%
250,000 – 1,000,000
17.4%
40.0%
40.0%
More than 1,000,000
8.7%
0.0%
0.0%
Corporate Structure
C
26.1%
20.0%
40.0%
S
60.9%
60.0%
40.0%
Partnership
0.0%
0.0%
0.0%
LLC
8.7%
20.0%
0.0%
Sole Proprietorship
4.3%
0.0%
20.0%
Average # of Agency Locations
(Main & Branch O!ces)
1.3
1.2
1.4
Total Square Footage of Office Space
2,898
2,806
3,210
# of States in which Offices are Located
1.2
1.2
1.0
% of Agencies with an ESOP
0.0%
0.0%
0.0%
% of Stock Owned by ESOP
0.0%
0.0%
0.0%
Shareholders
Number of Shareholders (excluding ESOP)
1.8
1.8
1.5
High
5.0
Low
1.0
% Owned by Largest Shareholder
80.1%
71.2%
88.0%
High
100.0%
Low
49.0%
Current Age of Largest Shareholder
56.2
51.4
57.0
% of Agencies Owned by Another Corporation
4.5%
Description of Parent Corporation
Financial Institution
100%
National Broker
0%
Other
0%
Member of Group
% of Agencies Belonging to a Franchise, Cluster,
Alliance/Network or Aggregator Group
39.1%
Groups included TIA, Marketsource,
Consolidated Agencies, LLC, Continental
Insurance Agency Alliance, ISU,
Bainswest, DS Risk Management Group,
and Combined Agents of America.
Pro!le
(of Agencies in this Study Group)