


 196 / 227


1$785$/ 5(0(',(6
3DJH RI
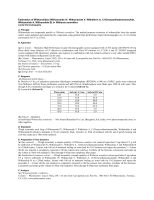
Table-27: Peak area of Withanolide A in sample (B. No. WS/06Lot10)
Replicate
Conc-1
(753.6 mg/100ml)
Conc-2
(1503.2 mg/100ml)
Conc-3
(2096.0 mg/100ml)
Replicate - 1
382010
797140
1101225
Replicate - 2
393611
784022
1120023
Mean
387810.5
790581
1110624
RSD
1.50
0.83
0.85
Table-28: Peak area of Withanolide B
Different Concentrations
Withanolide B
(mcg/ml)
Dilution -6
(21.09)
Dilution -5
(42.19)
Dilution -4
(86.38)
Dilution -3
(172.76)
Dilution -2
(345.51)
Dilution -1
(675.18)
S. solution
(1350.36)
Replicate – 1
553596
1095189
2157826
4196971
7938851
12728719
12264511
Replicate – 2
552800
1094573
2156794
4205282
7947620
12721830
12206630
Replicate – 3
552601
1096209
2156648
4174239
7944196
12736068
12166317
Replicate – 4
552865
1094840
2139922
4205370
7953428
12723957
12126384
Replicate – 5
552430
1093649
2158084
4205743
7963457
12720153
12051739
Mean
552858
1094892
2153855
4197521
7949510
12726145
12163116
RSD
0.08
0.09
0.36
0.32
0.12
0.05
0.66
Table-29: Peak area of Withanolide B in sample (B. No. WS/06Lot10)
Replicate
Conc-1
(753.6 mg/100ml)
Conc-2
(1503.2 mg/100ml)
Conc-3
(2096.0 mg/100ml)
Replicate - 1
122902
242191
336094
Replicate - 2
120722
239205
338649
Mean
121812
240698
337371.5
RSD
0.89
0.62
0.38
4.3.9) Conclusion:
From the above analytical data it is observed that the related standard deviation of peak
areas of different concentrations of Withanoside IV, Withanoside V, Withaferin A, 12-Deoxy
withastramonolide, Withanolide A, Withanolide B in sample as well as standard is
<2.0%.