


 39 / 124


South-North Corridor GRIP 2017 |
39
0
4,500
4,000
3,500
3,000
2,500
2,000
1,500
1,000
500
TWh/y
2017 2018 2019 2020 2021 2022 2023 2024 2025 2026 2027 2028 2029 2030 2031 2032 2033 2034 2035 2036 2037
Region
Rest of EU-28
Total
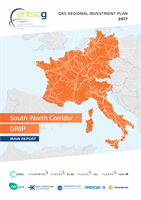
Annual demand for nal demand
(residential, commercial, industrial and transportation)
Figure 3.16:
Evolution of the annual demand for final demand (residential, commercial, industrial and transportation)
between 2017 and 2037 according to the Blue Transition scenario
(Source: projection based on data from TSOs collected by ENTSOG)
0
1,600
1,400
1,200
1,000
800
600
400
200
TWh/y
2017 2018 2019 2020 2021 2022 2023 2024 2025 2026 2027 2028 2029 2030 2031 2032 2033 2034 2035 2036 2037
Region
Rest of EU-28
Total
Annual demand for power generation
Figure 3.17:
Evolution of the annual demand for power generation between 2017 and 2037 according to the Blue Transition
scenario (Source: projection based on data from TSOs collected by ENTSOG)
It is clear how the general stability in demand in the next two decades depends
mainly on the increasing share of demand for power generation, with a growth rate
constantly above zero, unlike the final demand, that is expected to begin decreasing
after 2023 at European and Regional level.
These trends reflect a double push towards CO ² emissions reduction, stemming
from efficiency measures undertaken in the residential segment from one side and
the substitution of coal with gas in the power generation sector from the other side.