


 190 / 227


1$785$/ 5(0(',(6
3DJH RI
PEAK AREA OF WITHANOLIDE B
Table-16
Different Concentrations
Withanolide B
(mcg/ml)
Dilution -6
(21.09)
Dilution -5
(42.19)
Dilution -4
(84.39)
Dilution -3
(168.79)
Dilution -2
(337.59)
Dilution -1
(675.18)
S. solution
(1350.36)
Replicate – 1
553596
1095189
2157826
4196971
7938851
12728719
12264511
Replicate –2
552800
1094573
2156794
4205282
7947620
12721830
12206630
Replicate –3
552601
1096209
2156648
4174239
7944196
12736068
12166317
Replicate –4
552865
1094840
2139922
4205370
7953428
12723957
12126384
Replicate – 5
552430
1093649
2158084
4205743
7963457
12720153
12051739
Mean
552858
1094892
2153855
4197521
7949510
12726145
12163116
Response factor
Area /
concentration
26202.60
25946.08
25520.36
24867.57
23547.83
18848.52
9007.31
Mean
(Dilution 3 to 6)
25634.15
RSD
(Dilution 3 to 6)
1.97
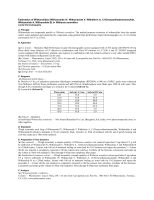
LINEARITY GRAPH PEAK AREA Vs CONCENTRATION
0 100 200 300 400 500 600 700 800
0
1000000
2000000
3000000
4000000
5000000
6000000
7000000
8000000
9000000
10000000
11000000
12000000
13000000
14000000
Best-fit values
Slope
Y-intercept when X=0.0
X-intercept when Y=0.0
1/slope
95% Confidence Intervals
Slope
Y-intercept when X=0.0
X-intercept when Y=0.0
Goodness of Fit
r²
Sy.x
Is slope significantly non-zero?
F
DFn, DFd
P value
Deviation from zero?
Data
Number of X values
Maximum number of Y replicates
Total number of values
Number of missing values
18750 ± 452.1
625700 ± 143900
-33.37
0.00005334
17820 to 19670
331000 to 920400
-62.24 to -5.755
0.9840
565800
1719
1.000, 28.00
< 0.0001
Significant
6
5
30
0
Concentration of Withanolide B (mcg/ml)
Area