


 188 / 227


1$785$/ 5(0(',(6
3DJH RI
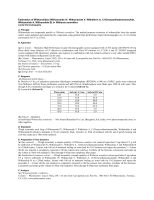
PEAK AREA OF 12-DEOXY WITHASTRAMONOLIDE
Table-14
Different Concentrations
12-Deoxy
withastramonolide
(mcg/ml)
Dilution -6
(22.21)
Dilution -5
(44.41)
Dilution -4
(88.83)
Dilution -3
(177.65)
Dilution -2
(355.30)
Dilution -1
(710.60)
S. solution
(1421.20)
Replicate – 1
635487
1256078
2472835
4800626
9145644
14809446
18080882
Replicate –2
634565
1254992
2469751
4809678
9138372
14845283
18085009
Replicate –3
634904
1256714
2471386
4778467
9140140
14833377
18068450
Replicate –4
634821
1256803
2448908
4808531
9151223
14874117
18045786
Replicate – 5
634615
1254538
2471248
4813165
9156566
14859008
17998894
Mean
634878
1255825
2466826
4802093
9146389
14844246
18055804
Response factor
Area /
concentration
28590.08
28276.39
27771.75
27031.20
25742.72
20889.74
12704.62
Mean
(Dilution 3 to 6)
27917.36
RSD
(Dilution 3 to 6)
2.11
LINEARITY GRAPH PEAK AREA Vs CONCENTRATION
0 100 200 300 400 500 600 700 800
0
2500000
5000000
7500000
10000000
12500000
15000000
17500000
Best-fit values
Slope
Y-intercept when X=0.0
X-intercept when Y=0.0
1/slope
95% Confidence Intervals
Slope
Y-intercept when X=0.0
X-intercept when Y=0.0
Goodness of Fit
r²
Sy.x
Is slope significantly non-zero?
F
DFn, DFd
P value
Deviation from zero?
Data
Number of X values
Maximum number of Y replicates
Total number of values
Number of missing values
20790 ± 465.2
678600 ± 155800
-32.65
0.00004811
19830 to 21740
359500 to 997800
-60.74 to -5.678
0.9862
612700
1996
1.000, 28.00
< 0.0001
Significant
6
5
30
0
Concentration of 12-Deoxy withastramonolide
Area