


 186 / 227


1$785$/ 5(0(',(6
3DJH RI
PEAK AREA OF WITHANOSIDE V
Table-12
Different Concentrations
Withanoside V
(mcg/ml)
Dilution -6
(18.76)
Dilution -5
(37.52)
Dilution -4
(75.04)
Dilution -3
(150.08)
Dilution -2
(300.15)
Dilution -1
(600.30)
S. solution
(1200.60)
Replicate – 1
151294
298008
586819
1146136
2238822
4334899
8731747
Replicate –2
151121
297953
585559
1146843
2237319
4327804
8721728
Replicate –3
151156
298036
585906
1141122
2243282
4330341
8719358
Replicate –4
151277
297352
581818
1152990
2237337
4338646
8718285
Replicate – 5
150985
297517
584964
1151745
2248262
4345473
8714428
Mean
151167
297773
585013
1147767
2241004
4335433
8721109
Response factor
Area /
concentration
8058.19
7936.65
7796.28
7647.96
7466.28
7222.11
7263.96
Mean
(Dilution 2 to 6)
7781.072
RSD
(Dilution 2 to 6)
2.68
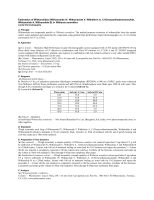
LINEARITY GRAPH PEAK AREA Vs CONCENTRATION
0 250 500 750 1000 1250 1500
0
2500000
5000000
7500000
10000000
Best-fit values
Slope
Y-intercept when X=0.0
X-intercept when Y=0.0
1/slope
95% Confidence Intervals
Slope
Y-intercept when X=0.0
X-intercept when Y=0.0
Goodness of Fit
r²
Sy.x
Is slope significantly non-zero?
F
DFn, DFd
P value
Deviation from zero?
Data
Number of X values
Maximum number of Y replicates
Total number of values
Number of missing values
7225 ± 10.77
37920 ± 5644
-5.249
0.0001384
7203 to 7247
26430 to 49410
-8.152 to -2.352
0.9999
25390
450000
1.000, 33.00
< 0.0001
Significant
7
5
35
0
Concentration of Withanoside V (mcg/ml)
Area