


 187 / 227


1$785$/ 5(0(',(6
3DJH RI
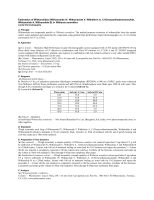
PEAK AREA OF WITHAFERIN A
Table-13
Different Concentrations
Withaferin A
(mcg/ml)
Dilution -6
(23.05)
Dilution -5
(46.09)
Dilution -4
(92.19)
Dilution -3
(184.39)
Dilution -2
(368.78)
Dilution -1
(737.55)
S. solution
(1475.10)
Replicate – 1
573810
1134850
2231492
4332623
8325259
14666731
21469032
Replicate –2
573224
1134742
2227105
4337796
8322031
14756049
21438480
Replicate –3
573669
1134589
2228288
4310236
8317825
14770374
21482780
Replicate –4
573097
1134172
2211324
4335168
8328440
14788044
21438918
Replicate – 5
572942
1131663
2224755
4340882
8338317
14782253
21442185
Mean
573348
1134003
2224593
4331341
8326374
14752690
21454279
Response factor
Area /
concentration
24875.80
24600.44
24129.54
23490.43
22578.47
20002.29
14544.29
Mean
(Dilution 3 to 6)
24274.053
RSD
(Dilution 3 to 6)
2.16
LINEARITY GRAPH PEAK AREA Vs CONCENTRATION
0 100 200 300 400 500 600 700 800
0
2500000
5000000
7500000
10000000
12500000
15000000
17500000
Best-fit values
Slope
Y-intercept when X=0.0
X-intercept when Y=0.0
1/slope
95% Confidence Intervals
Slope
Y-intercept when X=0.0
X-intercept when Y=0.0
Goodness of Fit
r²
Sy.x
Is slope significantly non-zero?
F
DFn, DFd
P value
Deviation from zero?
Data
Number of X values
Maximum number of Y replicates
Total number of values
Number of missing values
19900 ± 246.6
408700 ± 85730
-20.54
0.00005026
19390 to 20400
233200 to 584300
-36.38 to -5.052
0.9957
337100
6509
1.000, 28.00
< 0.0001
Significant
6
5
30
0
Concentrationof Withaferin-A (mcg/ml)
Area