


 102 / 113

Analysis of Agencies with Revenues Greater Than $10,000,000
102 of 113
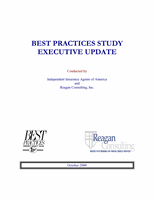
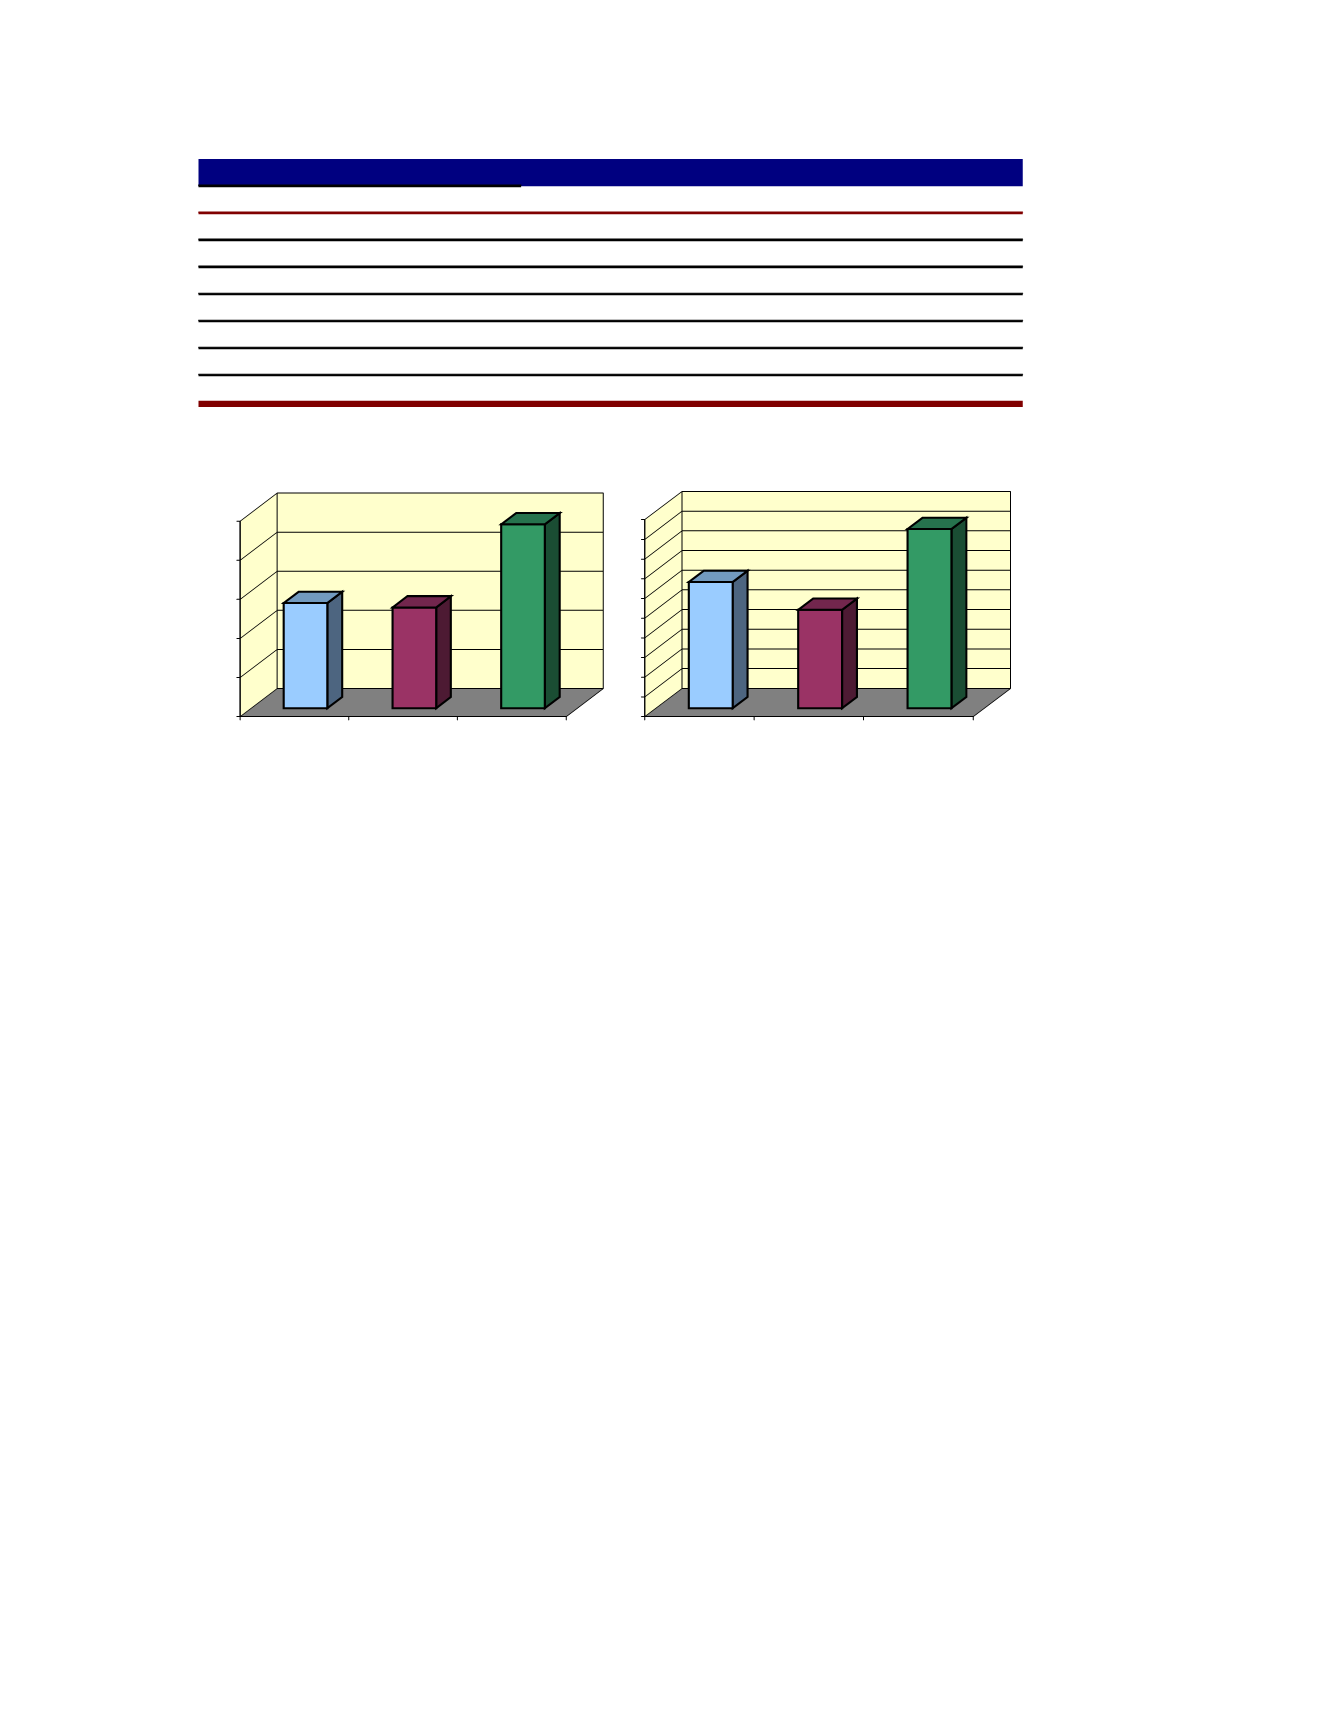
B. Growth in Profitability (% change from prior year)
Average +25% Profit +25% Growth
Net Revenues (Total)
13.5%
12.9%
23.5%
Compensation Expense
16.1%
15.3%
30.8%
Selling Expense
13.9%
13.0%
19.3%
Operating Expense
11.8%
6.7%
19.1%
Administrative Expense
7.2%
11.8%
5.3%
Pre-Tax Profit
12.8%
10.0%
18.2%
Operating Pre-tax Profit
-6.2%
-8.7%
*
* - Insufficient Data
0.0%
5.0%
10.0%
15.0%
20.0%
25.0%
Average
+25% Profit
+25% Growth
Growth in Net Revenues
0.0%
2.0%
4.0%
6.0%
8.0%
10.0%
12.0%
14.0%
16.0%
18.0%
20.0%
Average
+25% Profit
+25% Growth
Growth in Pre-Tax Profit