


 33 / 113

Analysis of Agencies with Revenues Between $500,000 and $1,250,000
33 of 113
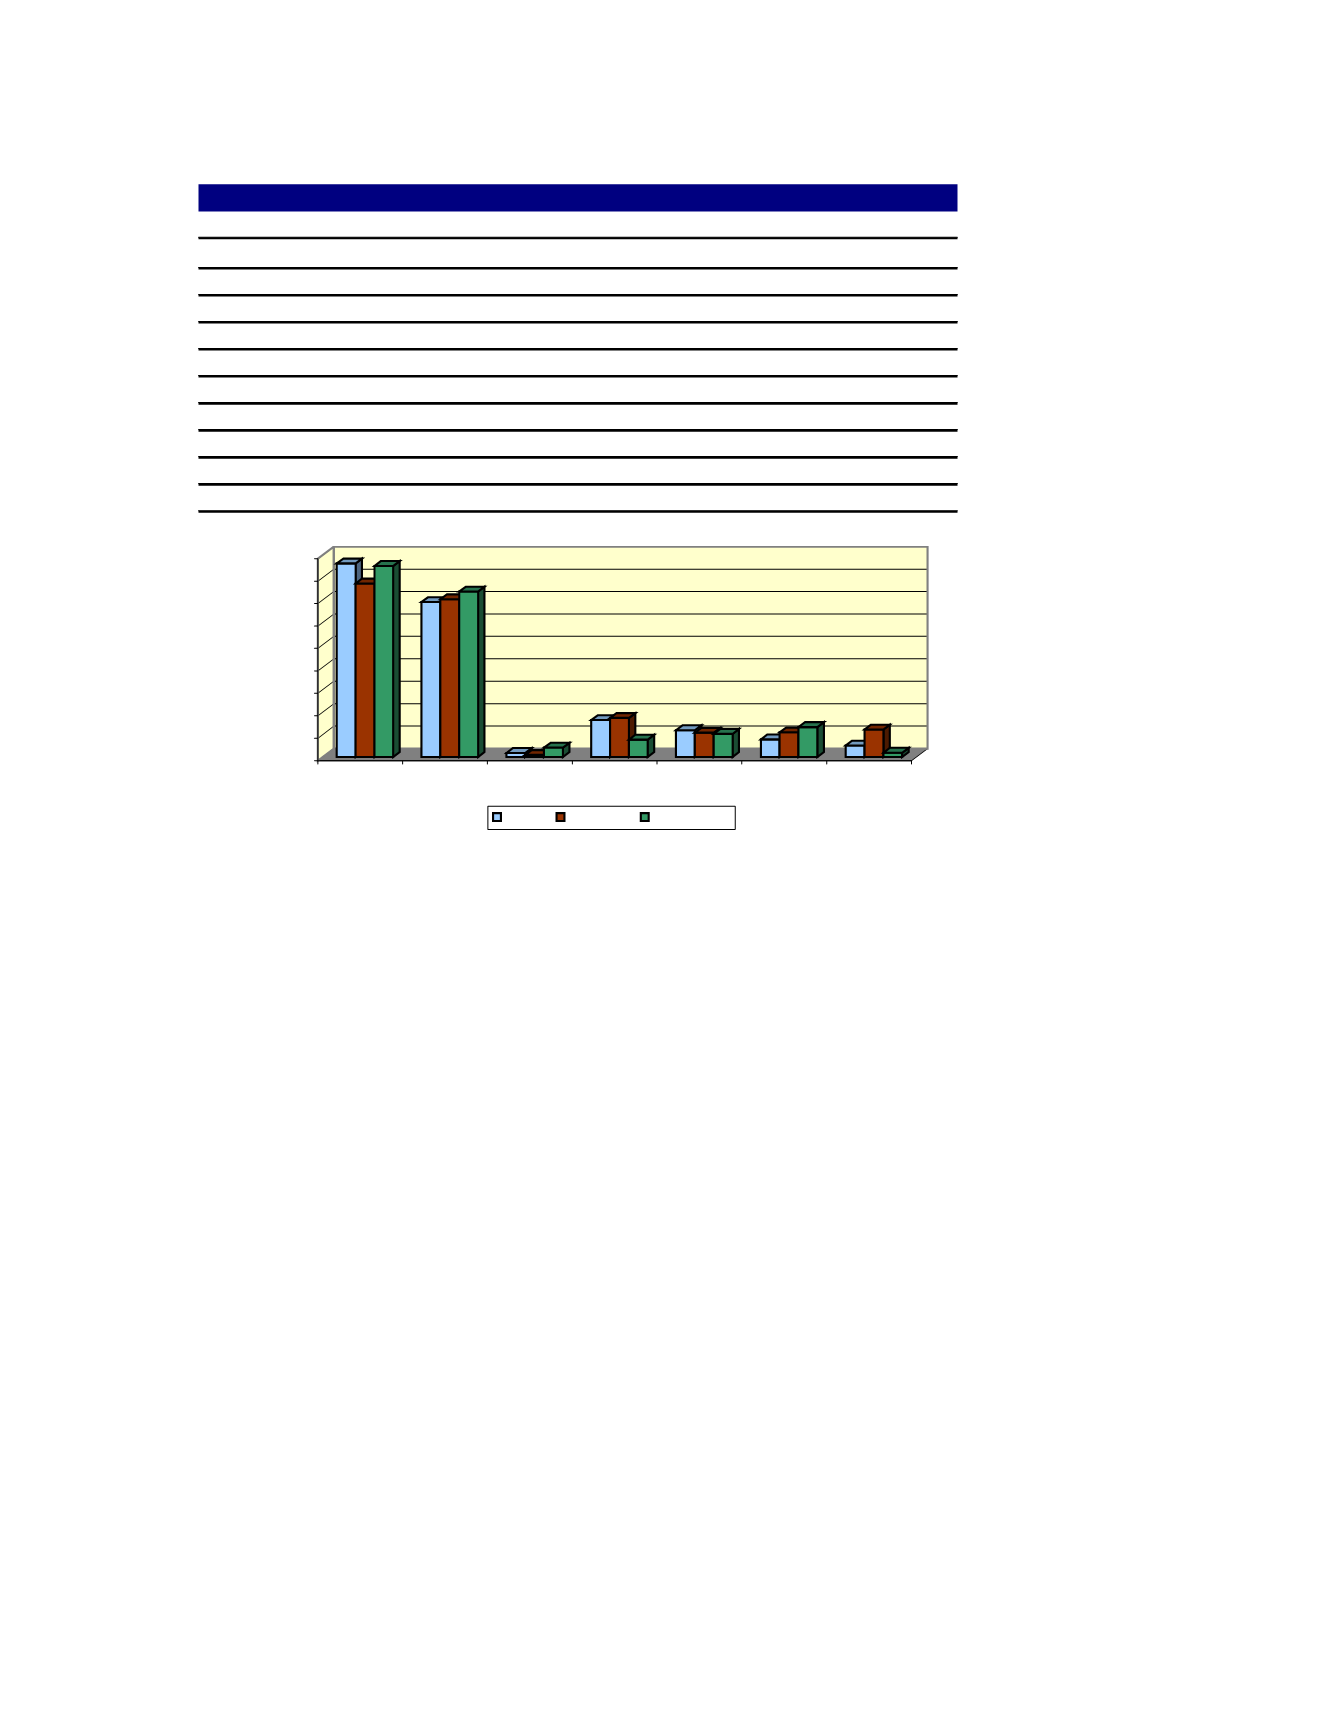
II. Revenues (Agencies with Revenues Between $500,000 and $1,250,000)
A. % of Revenue by Source
Average +25% Profit +25% Growth
Commercial P&C
43.1% 38.7% 42.6%
Personal P&C
34.6% 35.2% 36.9%
P&C Service Fees
0.9%
0.5%
2.1%
Contingent
8.2%
8.7%
3.9%
Group L&H
6.0%
5.4%
5.2%
Individual L&H
3.9%
5.5%
6.7%
Investments
2.5%
6.1%
0.9%
Miscellaneous
0.7%
0.0%
1.8%
Total Revenues
100.0% 100.0% 100.0%
Brokerage Commission Expense
1.9%
0.0%
0.6%
Net Revenues
98.1% 100.0% 99.4%
0.0%
5.0%
10.0%
15.0%
20.0%
25.0%
30.0%
35.0%
40.0%
45.0%
% Total Revenue
Commercial
P&C
Personal
P&C
P&C Service
Fees
Contingent Group L&H Individual
L&H
Investments
Average +25% Profit
+25% Growth