


 108 / 122

108 |
Southern Corridor GRIP 2017–2026
20–40%
<20%
<40%
10–30%
>20%
0–50GWh/d
0–80% of capacity
50–250GWh/d
250–600GWh/d
600–1100GWh/d
>1100GWh/d
<30%
80–99% of capacity
99–100% of capacity
20–40%
<20%
<40%
10–30%
>20%
0–50GWh/d
0–80% of capacity
50–250GWh/d
250–600GWh/d
600–1100GWh/d
>1100GWh/d
<30%
80–99% of capacity
99–100% of capacity
20–40%
<20%
<40%
10–30%
>20%
0–50GWh/d
0–80% of capacity
50–250GWh/d
250–600GWh/d
600–1100GWh/d
>1100GWh/d
<30%
80–99% of capacity
99–100% of capacity
20–40%
<20%
<40%
10–30%
>20%
0–50GWh/d
0–80% of capacity
50–250GWh/d
250–600GWh/d
600–1100GWh/d
>1100GWh/d
<30%
80–99% of capacity
99–100% of capacity
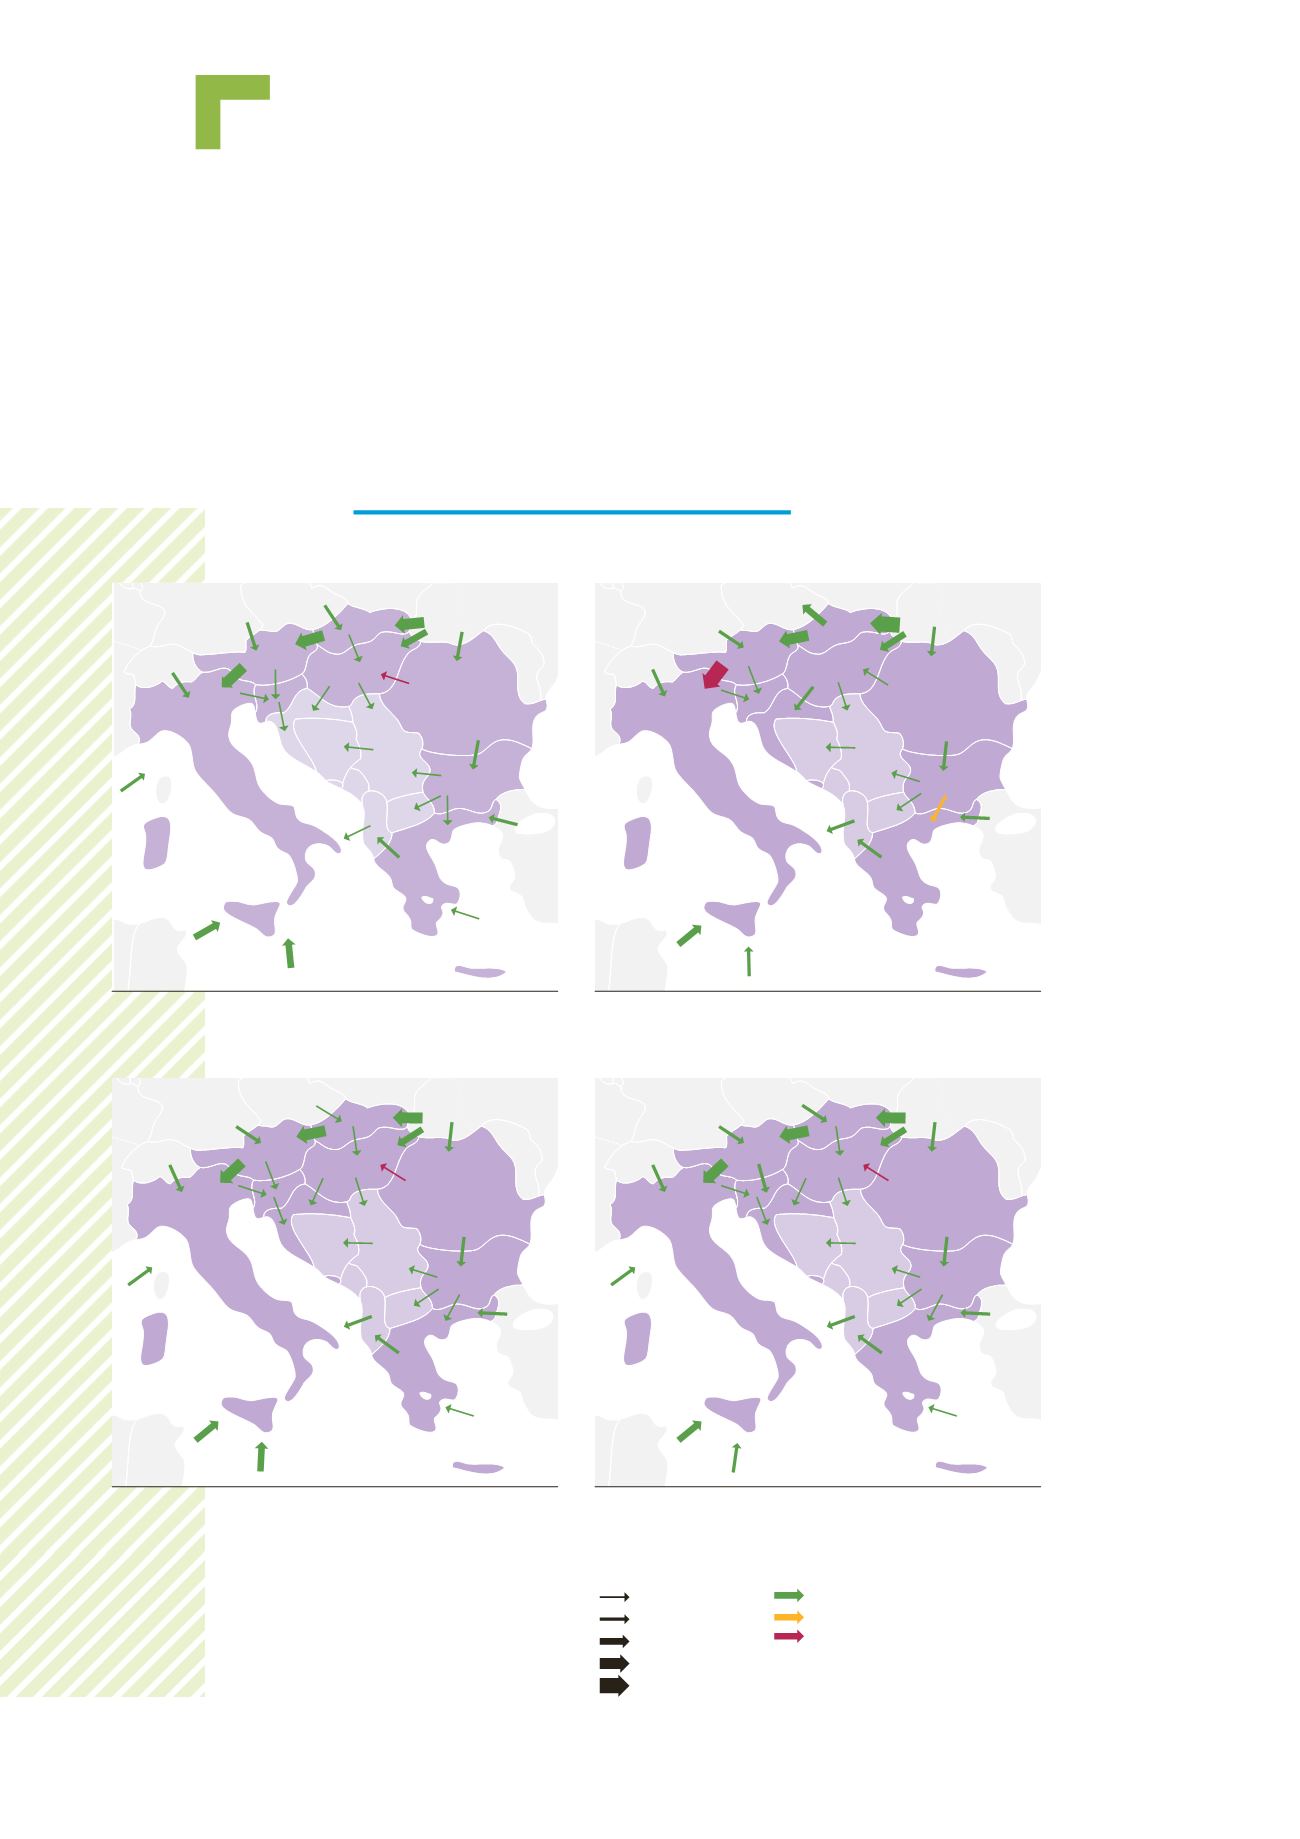
Figure 7.4.1:
2020 Low Reference
Figure 7.4.3:
2020 Low AZ max
Figure 7.4.2:
2020 low RU max
Figure 7.4.4:
2020 Low LNG max
7.4 Flows response to price
signals
In this paragraph we examine how the flows in the Region are changed when the
supply source prices are modified with reference to the reference case. The gas
sources examined are Russia, LNG and Azerbaijan. The price of one source at a
time is reduced by 10% and the flows are recalculated by the ENTSOG NeMo tool
which minimises the overall EU gas bill. The results are presented for the two
infrastructure levels (Low and PCI) and the two points in time (2020 and 2030).
7.4.1 LOW INFRASTRUCTURE CASE
Legend
20–40%
<20%
<40%
10–30%
>20%
0–50GWh/d
0–80% of capacity
50–250GWh/d
250–600GWh/d
600–1100GWh/d
>1100GWh/d
<30%
80–99% of capacity
99–100% of capacity