


 22 / 113

Analysis of Agencies with Revenues Less than $500,000
22 of 113
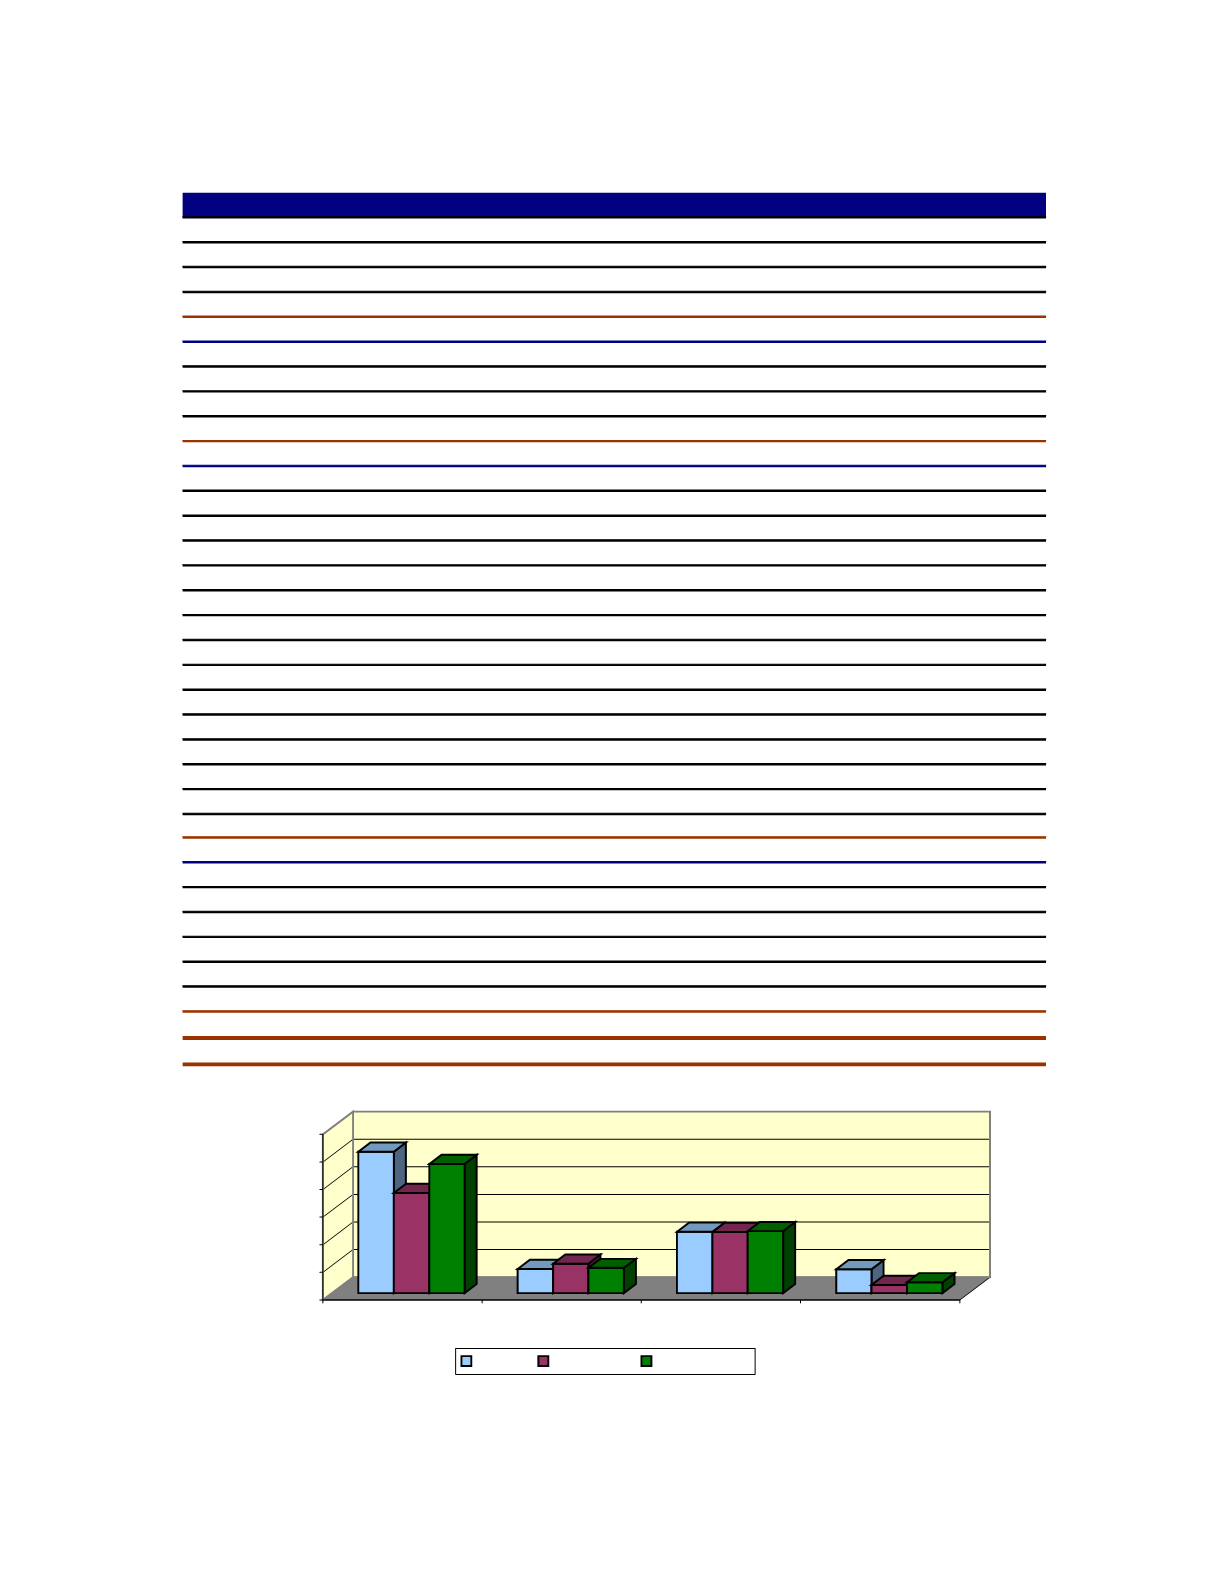
III. Expenses (Agencies with Revenues Less than $500,000)
Average +25% Profit +25% Growth
Compensation Expense
Total Payroll
43.9% 31.8% 40.6%
Benefits
7.3% 4.5%
6.2%
Total Compensation
51.3% 36.3% 46.8%
Selling Expenses
T & E/Conventions
3.0% 3.1%
2.9%
Automobile
2.6% 3.7%
2.5%
Advertising/Promotions
3.1% 3.8%
3.7%
Total Selling
8.7% 10.7%
9.1%
Operating Expenses
Occupancy
5.6% 5.8%
3.8%
Telephone
2.3% 2.6%
2.5%
Postage
1.2% 1.1%
1.2%
Supplies/Printing
2.4% 3.7%
3.9%
Dues/Subscriptions/Contributions
1.4% 0.7%
1.3%
Taxes/Licenses
1.2% 1.2%
0.9%
Insurance
2.5% 3.2%
2.9%
Professional Fees
0.8% 0.2%
0.8%
Equip Rental/Maint
1.2% 1.0%
1.1%
Bad Debts
0.2% 0.4%
0.4%
Outside Services
0.5% 0.5%
0.1%
Data Processing
1.8% 0.6%
2.2%
Education/Training
0.6% 0.9%
0.8%
Miscellaneous
0.5% 0.3%
0.6%
Total Operating
22.2% 22.1% 22.5%
Administrative Expenses
Amortization
0.6% 0.8%
0.3%
Depreciation
4.2% 0.9%
1.9%
Officer Life
0.4% 0.3%
0.0%
Interest
2.2% 1.0%
1.7%
Other
1.3% 0.0%
0.0%
Total Administrative
8.7% 3.0%
3.9%
Total Expenses
90.8% 72.1% 82.3%
Pre-Tax Profit
9.2% 27.9% 17.7%
0.0%
10.0%
20.0%
30.0%
40.0%
50.0%
60.0%
% Net Revenue
Compensation
Selling
Operating
Adminstrative
Average +25% Profit
+25% Growth